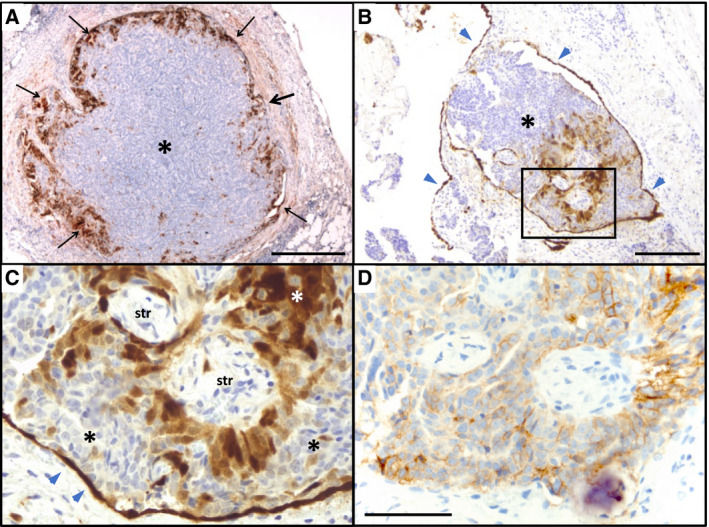
Fig. 4.

Immunohistochemical staining of peritoneal HGSC metastases. (A, B) Examples of peritoneal metastases showing calretinin expression, particularly on the invasive front (black arrows in panel A). (C–E) Higher magnification of the section marked in panel B stained for calretinin (C) or the tumor cell marker EPCAM (D). Blue arrowheads in B and C indicate the intact peritoneal mesothelium, which is strongly positive for calretinin and negative for EPCAM. *: tumor cells; str: stroma cells. Scale bars: 500 µm (A), 200 µm (B), and 50 µm (C, D).
