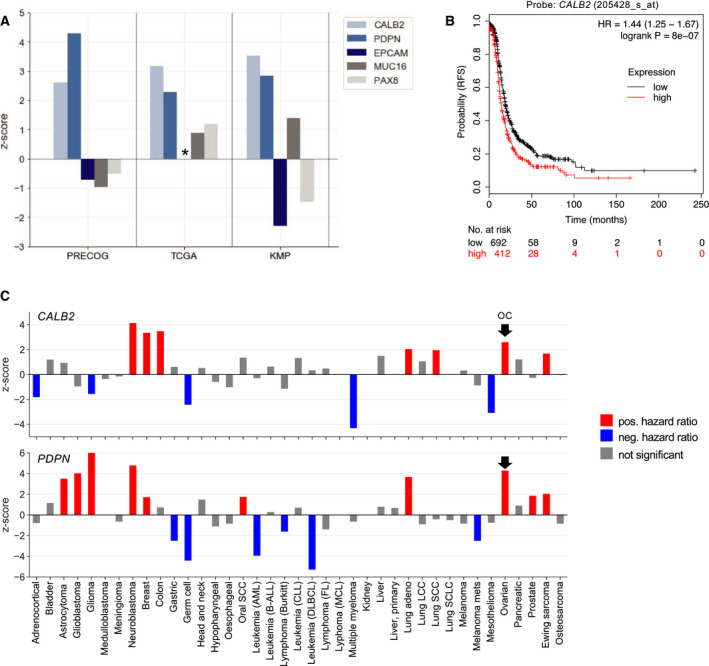
Fig. 6.

Association of CALB2 and PDPN with short relapse‐free (RFS) and overall (OS) HGSC survival. (A) z‐scores for CALB2 and PDPN and for comparison 3 epithelial markers based on data from the PRECOG and KM Plotter meta‐analysis databases [49, 50] and the TCGA microarray dataset [43] (PRECOG: OS of OC,TCGA: RFS of OC; KMP: RFS of HGSC. z‐score above 1 indicates a hazard ratio (HR > 1 (poor outcome; z‐score below −1 indicates a HR < 1 (favorable outcome. A z‐score of 1.96 or −1.96 corresponds to a logrank p value of 0.05. (B The Kaplan–Meier plot showing the association of CALB2 expression and a poor RFS (generated by Kaplan–Meier Plotter, 2017 version; http://kmplot.com). (C) z‐scores for CALB2 and PDPN across all cancer entities in the PRECOG database. Red: z‐score above 1.96 indicating a poor clinical outcome; blue: z‐score below −1.96 indicating a favorable outcome; gray: z‐score < 1.96 and >−1.96 (i.e., P < 0.05). The arrows point to OC.
