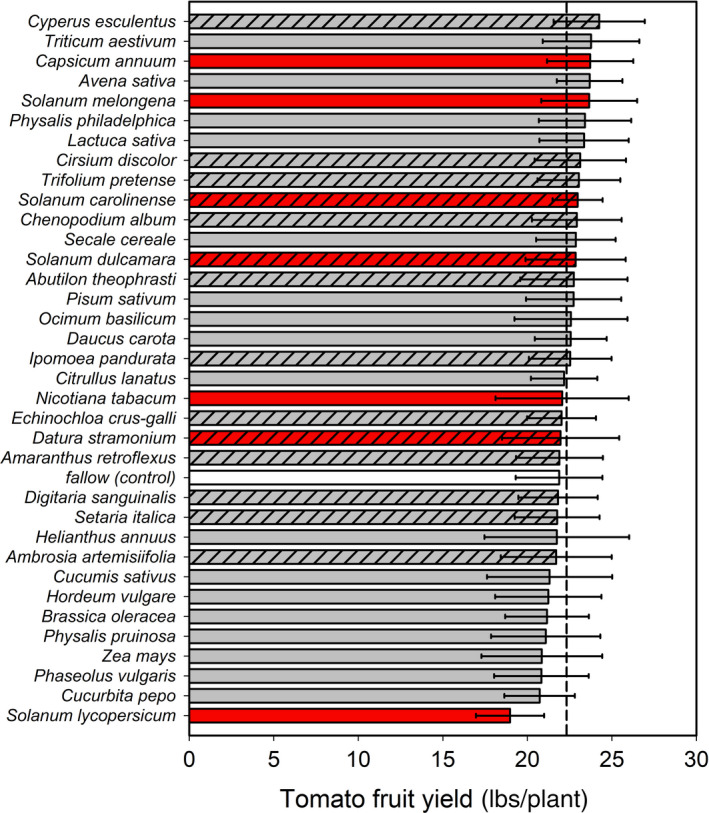
Figure 1.

Impact of identity of the conditioning plant species in year 1 (y‐axis) on tomato yield (mean ± 95% CI) in year 2 (x‐axis). Vertical dashed line represents the global mean across all plots (= 22.27); thus, 95% CIs that do not bracket this line over‐ or under‐perform relative to the community average. Red bars represent plants that are closely related to tomato, that is, in the family Solanaceae, while the white bar denotes the plant‐free fallow control. Hatched bars separate weed species from crops (unhatched)
