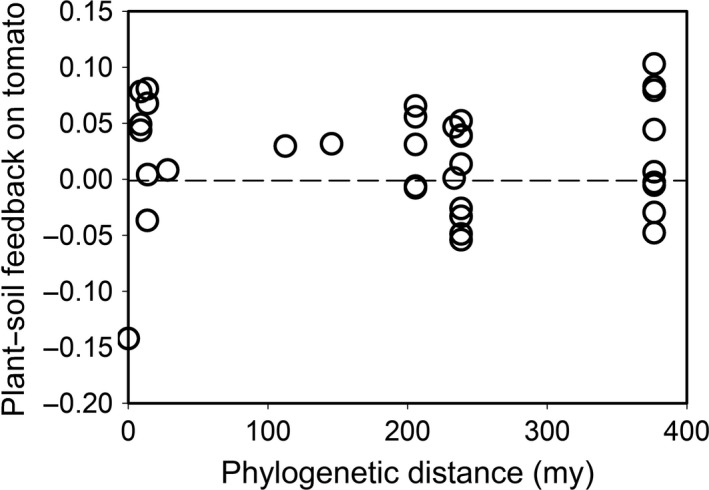
Figure 2.

Relationship between phylogenetic distance separating tomato from the species conditioning the soil in year 1 and plant–soil feedback on tomato yield in year 2. Each point is the mean across all plot replicates for the 35 plant species tested. Horizontal dashed line denotes an effect size of zero where the conditioning plant species had no impact on tomato growth relative to the control. Effect size was calculated as ln(species/control)
