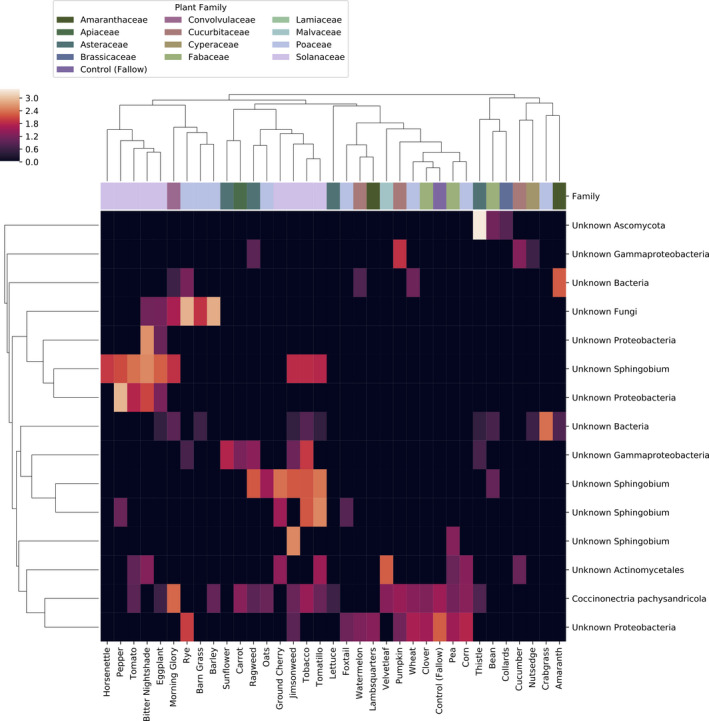
Figure 5.

Random forest models identify microbial features predictive of planting history. The top 15 most predictive bacterial and fungal features are shown (minimum importance score 0.010), and the heatmap displays their normalized average relative abundances within each plant species. Samples and features are hierarchically clustered by UPGMA of pairwise Bray–Curtis dissimilarities
