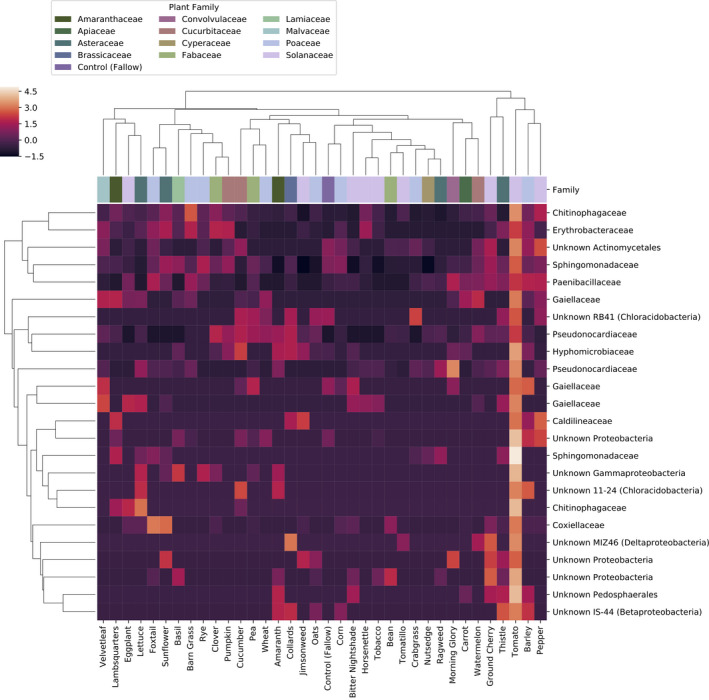
Figure 6.

Bacterial features most abundant in tomato soils. The heatmap shows the normalized relative abundance of 24 features identified as being differentially abundant among plant species and block, and most abundant in tomato soils. Values shown on the heatmap represent the mean of each feature averaged across each plant species (N = 8 per species). Column margin colors indicate the family affiliation of each plant species represented in that column. Samples and features are hierarchically clustered by UPGMA of pairwise Bray–Curtis dissimilarities
