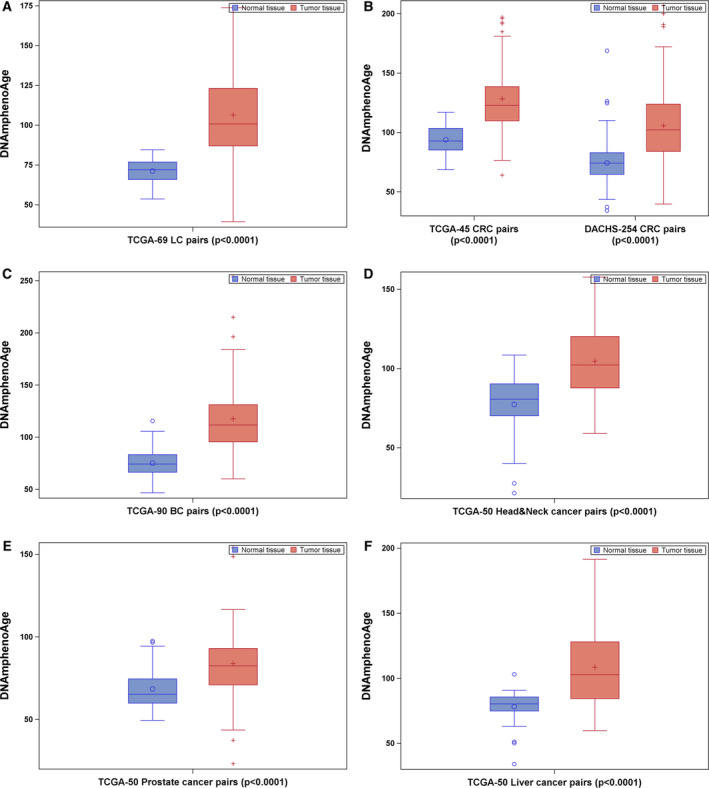
Fig. 2.

DNAmPhenoAge in tumor‐normal tissue pairs of patients with LC (n = 69; A), CRC (n = 299; B), BC (n = 90; C), head‐and‐neck cancer (n = 50; D), prostate cancer (n = 50; E), and liver cancer (n = 50; F). Difference between tumor and normal tissues was examined using nonparametric Wilcoxon signed‐rank test.
