Fig. 1.

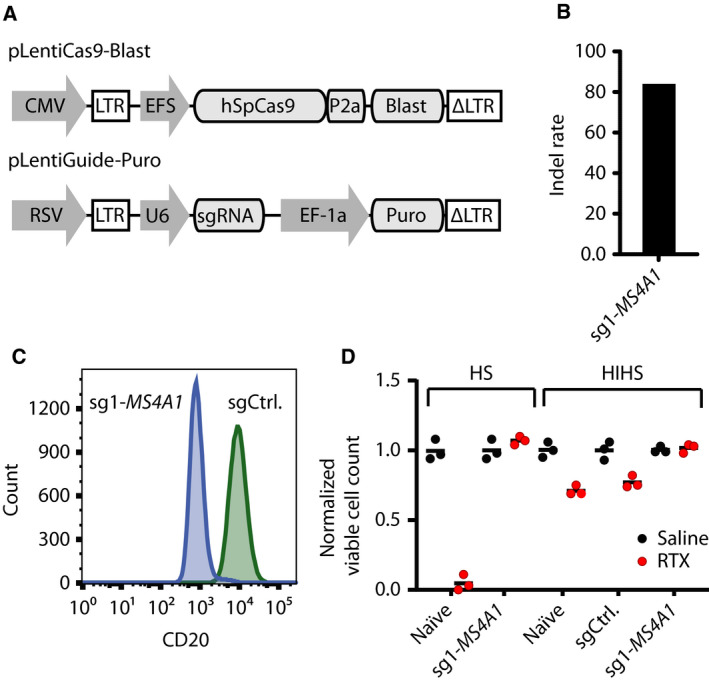
Absolute RTX resistance in OCI‐Ly‐7/MS4A1 KO cells. (A) Schematics of vectors used to generate OCI‐Ly‐7‐Cas9 cells with stable SpCas9 expression and to deliver sgRNAs. (B) Indel rates in the OCI‐Ly‐7‐Cas9 9 days after delivery of a sgRNA targeting MS4A1. (C) Flow cytometric determination of CD20 protein levels in OCI‐Ly‐7‐Cas9 9 days after MS4A1 sgRNA delivery. (D) RTX drug assay with either active or HIHS. Cells treated with 20% HIHS were grown in 50 µg·mL−1 RTX, whereas cells treated with 20% active HS were exposed to a RTX concentration of 10 µg·mL−1. Living cells were enumerated by trypan blue exclusion following 48 h of exposure. Black dots represent saline‐treated populations, whereas red dots display RTX‐treated populations. For each population of cells, living cells following treatment were normalized by dividing the number of cells with the mean of living cells counted in the saline‐treated cell population. For each population, treatment (saline or RTX) was carried out in triplicates; mean is shown.
