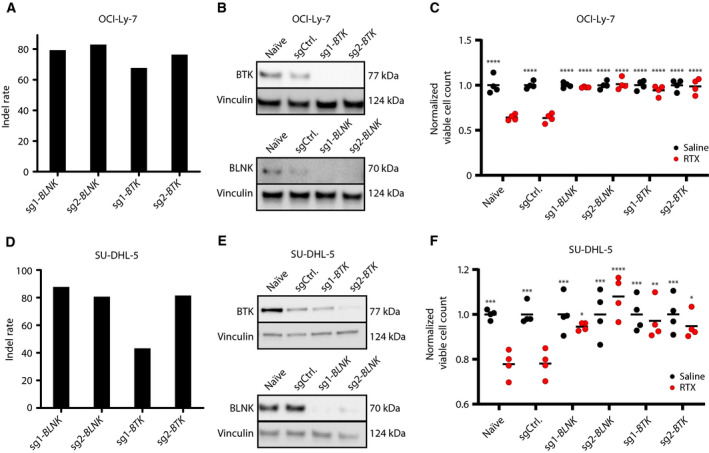
Fig. 3.

BLNK and BTK gene KO confers resistance to RTX in OCI‐Ly‐7. (A–C) and SU‐DHL‐5 (D–F) GCB subclass cells. (A, D) Assessment of CRISPR KO on the genomic level by TIDE. Following two weeks of puromycin, gDNA was harvested and sequence traces from sgRNA‐treated populations were compared by TIDE with sequences from cells treated with control sgRNA, allowing frequency of indels to be quantified. (B, E) Verification of BLNK and BTK KO assessed at the protein level by western blot. (C, F) RTX drug assay under non‐CDC conditions. Cells treated with 50 µg·mL−1 RTX in 20% HIHS were enumerated by trypan blue exclusion following 72 h of exposure. Black dots represent saline‐treated populations, whereas red dots display RTX‐treated populations. For each population of cells, living cells following treatment were normalized by dividing the number of cells with the mean of living cells counted in the saline‐treated cell population. For each population, treatment (saline or RTX) was carried out in triplicates; mean is shown. Dunnett's multiple comparison test was performed with RTX‐treated sgCtrl population (*< 0.05, **< 0.005, ***< 0.0005, ****< 0.0001).
