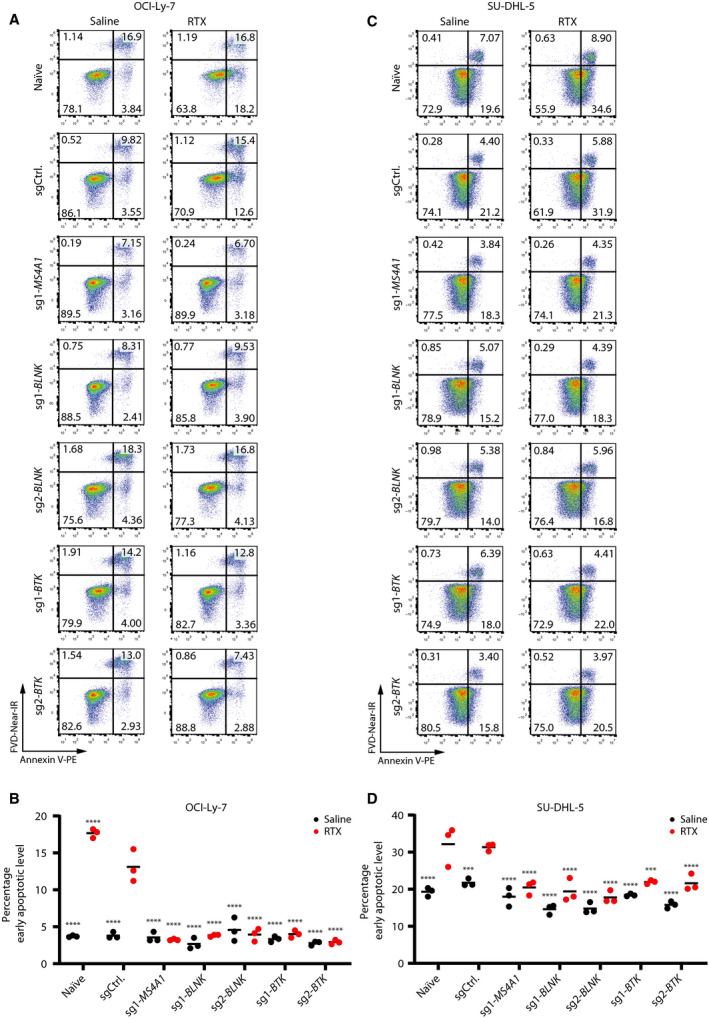
Fig. 6.

Absence of RTX‐induced apoptosis in BLNK and BTK KO OCI‐Ly‐7. (A, B) and SU‐DHL‐5 cells (C, D). (A, C) RTX apoptosis assay with non‐CDC conditions; representative samples are shown. Cells were treated with 50 µg·mL−1 RTX in 20% HIHS. Levels of apoptosis were determined by annexin V and live/dead staining. OCI‐Ly‐7 cells were exposed to RTX for 24 h and SU‐DHL‐5 cells for 48 h. (B, D) Summarized percentage of early apoptotic cells. Black dots represent saline‐treated populations, whereas red dots display RTX‐treated populations. For each population, treatments (saline or RTX) were carried out in triplicates; mean is shown. Dunnett's multiple comparison test was performed with RTX‐treated sgCtrl population (***< 0.0005, ****< 0.0001).
