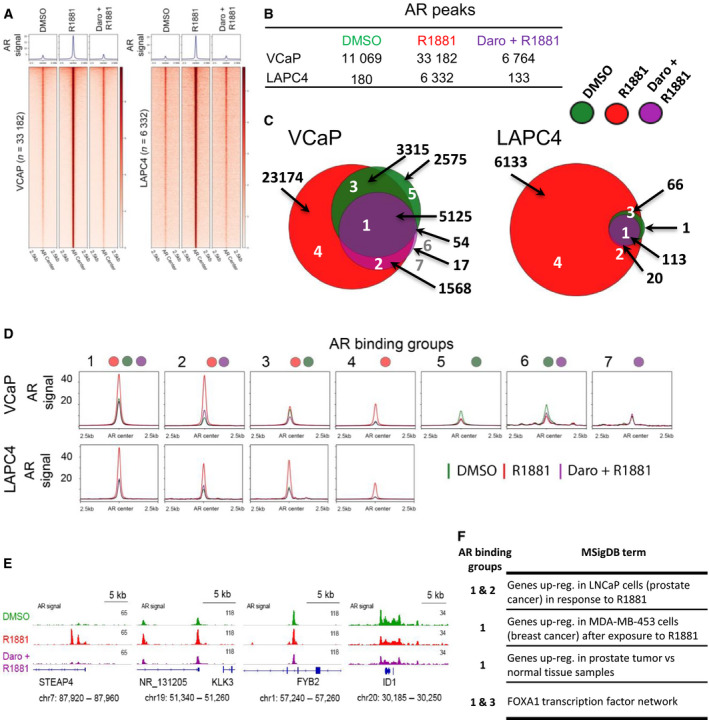
Fig. 2.

Genome‐wide AR occupancy is reduced by darolutamide treatment. (A) AR ChIP‐seq signals are shown at R1881‐induced AR‐binding sites for cells treated with DMSO, R1881, or R1881 plus 2 µm darolutamide. Regions were ordered by descending signal intensity of R1881 samples for each cell line. Number of binding sites and averaged signal at centered AR regions plus/minus 2.5 kbp are shown. (B) Table with number of AR peaks and (C) Euler diagram with overlapping AR peaks for the indicated conditions in VCaP (left) and LAPC4 cells (right). (D) Mean AR signals of DMSO (green), R1881 (red), and R1881 plus 2 µm darolutamide (purple) conditions at the identified AR‐binding clusters. (E) ChIP‐seq signals at the indicated gene regions for the different treatment conditions. (F) Selection of top enriched gene sets from Molecular Signaling Database associated with AR clusters defined in VCaP cells and analyzed by GREAT. All sets identified have a false discovery rate (FDR) below 0.05. Full tables are shown in Table S11.
