Fig. 4.

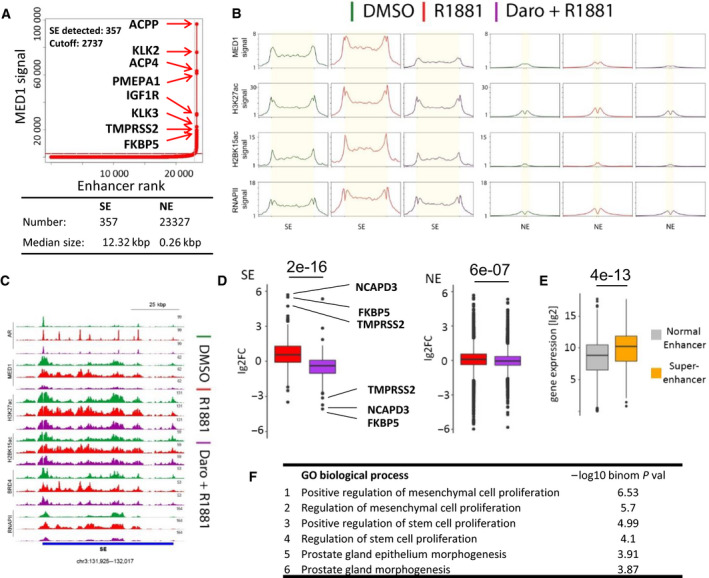
SE activation by R1881 and inhibition by darolutamide. (A) Overview of SEs identified in VCaP cells by ROSE and associated genes. The dotted red line shows the cutoff threshold for SEs. (B) Averaged protein occupancy and histone modification profiles at SEs (left) and NEs (right) for the treatments mentioned. (C) Top‐ranked SE identified in A is shown with indicated protein occupancies and histone modifications following the mentioned treatments. Bottom blue bar shows the SE region. (D) Log2 fold‐transformed gene expression changes (lg2FC) of SE‐ and NE‐associated genes after R1881 induction compared to DMSO (red), or after R1881 plus darolutamide compared to R1881 (purple). The top three R1881‐regulated genes are highlighted with their names. Numbers above the bar plots are the t‐test P‐values of the comparison between the groups. (E) Log2‐transformed expression values measured in R1881 condition of genes associated with NEs or SEs. The number above the bar plots is the t‐test P‐value of the comparison between the groups. (F) Molecular Signature Database gene sets significantly enriched with the genes proximal to SEs identified with GREAT and ranked by statistical significance. All sets are < 0.05 FDR value.
