
Figure 1.
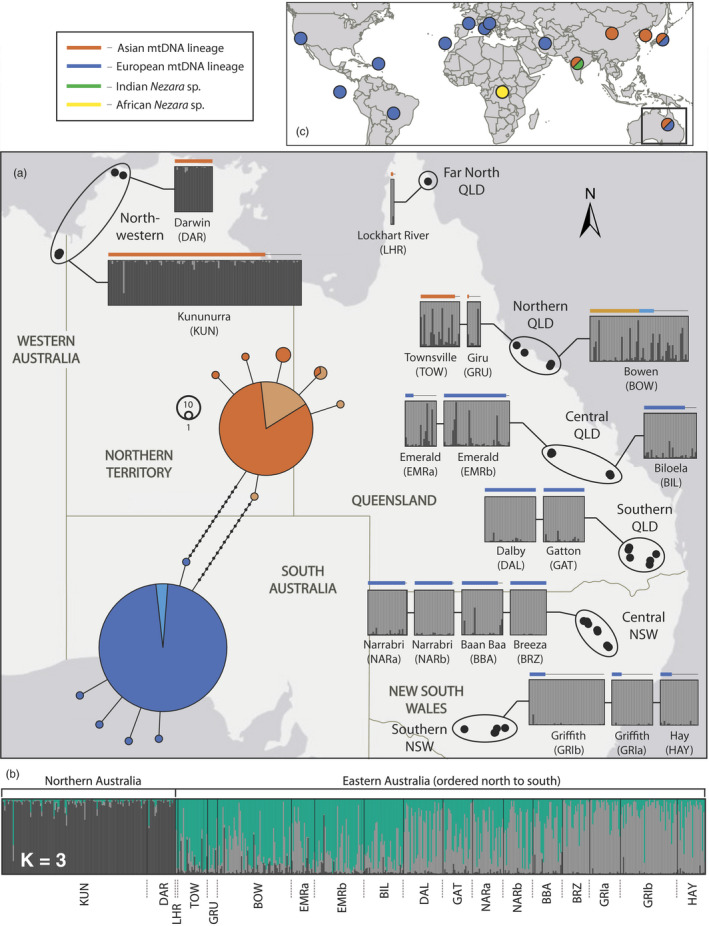
(a) Map of northern and eastern Australia with Nezara viridula sampling sites represented by black dots. The circles that surround sets of black dots amalgamate these nearby sampling sites into labelled regions (Table 1). Superimposed on the map is a haplotype network showing the relationship between the COI haplotypes of 480 Australian N. viridula individuals (all sequences), and also a K = 2 STRUCTURE analysis of the microsatellite data from 571 individuals. Horizontal bars above these locality‐specific inset boxes indicate the mitochondrial haplotype of the corresponding individual in the STRUCTURE analysis boxes below the bar. Those individuals that were genotyped, but which did not have their COI gene sequenced, are represented above the boxes by a thin black line. Bowen is the only location in which bugs with both mitochondrial haplotypes were found together, with a lighter shade of either orange or blue to distinguish bugs from that location from others. (b) A K = 3 STRUCTURE analysis is also shown below the map. (c) A global inset map is used to show the placement of all publicly available N. viridula sequences (Figure S1)