
Figure 4.
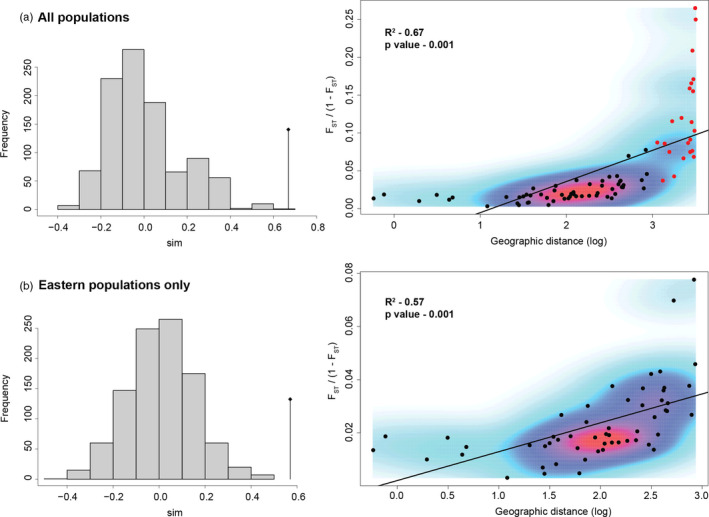
Two isolation‐by‐distance (IBD) relationships based on mantel tests are shown for Nezara viridula in Australia. The histograms summarize the result of mantel test simulations. Sites with fewer than 20 individuals, and those sampled a second time, were not included. All Australian N. viridula populations that fit this criteria are included in the top histogram and figure (a) but only the eastern Australian populations are included in the histogram and figure below (i.e., excluding the Darwin and Kununurra samples, (b)). The red points in figure (a) are pairwise comparisons between the Darwin and Kununurra samples and all eastern samples