
Figure 2.
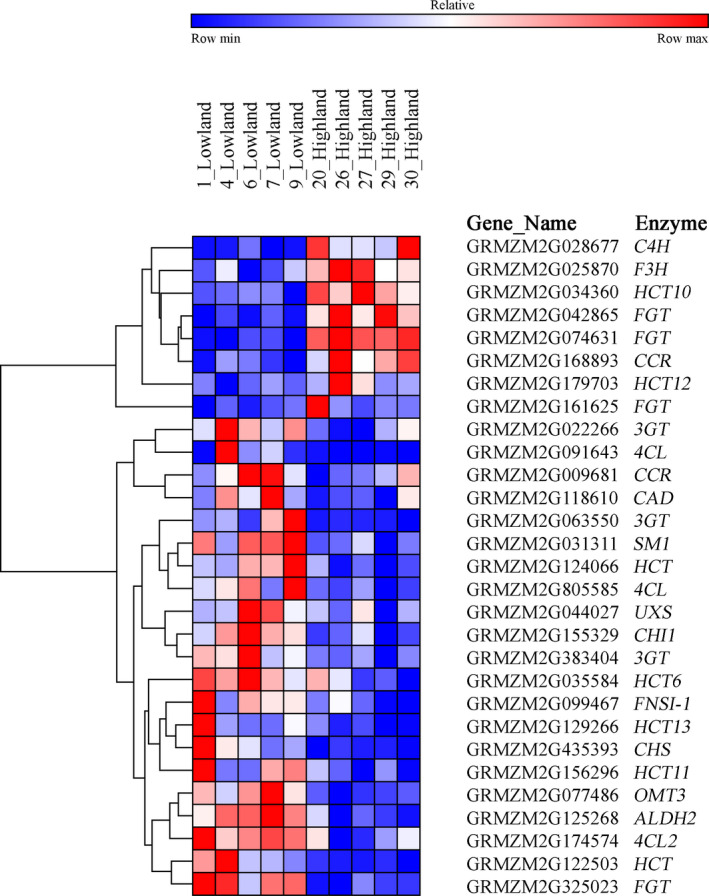
Highland and lowland landrace relative expression levels of normalized counts for differentially expressed (DE) phenylpropanoid, flavonoid, lignin, and nucleotide‐sugar interconversion genes. DE genes exhibited a FDR of 0.05 (Benjamini–Hochberg). Relative expression was determined for each row with red representing the population with the highest expression and blue representing the population with the lowest. We used the hierarchical clustering algorithm based on 1‐Pearson correlation distances to group genes with similar expression profiles across landraces. Enzyme gene names are as follows: ALDH2, aldehyde dehydrogenase 2; CAD, cinnamyl alcohol dehydrogenase; CCR, cinnamoyl‐CoA reductase; CHI1, chalcone isomerase; CHS, chalcone synthase; C4H, cinnamate‐4‐hydroxylase; FGT, flavonol glucosyltransferase; FNSI‐1, flavone synthase type 1; F3H, flavonoid‐3‐beta‐hydroxylase; HCT, hydroxycinnamoyl CoA transferase; HCT6, hydroxycinnamoyl CoA transferase 6; HCT10, hydroxycinnamoyl CoA transferase 10; HCT11, hydroxycinnamoyl CoA transferase 11; HCT12, hydroxycinnamoyl CoA transferase 12; HCT13, hydroxycinnamoyl CoA transferase 13; OMT3, Caffeoyl CoA O‐methyltransferase 3; SM1, salmon silk 1; UXS, UDP‐xylose synthase; 3GT, flavonoid 3‐O glucosyltransferase; 4Cl, 4‐coumarate: CoA ligase; 4CL2, 4‐coumarate: CoA ligase 2