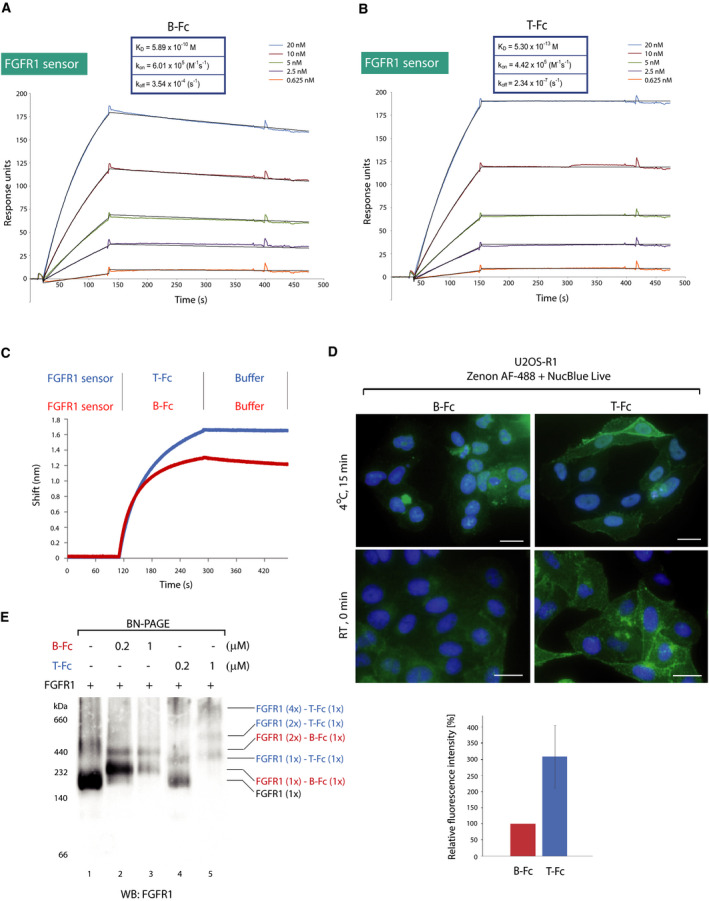
Fig. 2.

B‐Fc and T‐Fc bind FGFR1 with high affinity. (A, B) SPR‐determined kinetic parameters of the interaction between B‐Fc and T‐Fc, and FGFR1, respectively. The extracellular region of FGFR1 was immobilized on SPR sensors and incubated with various concentrations of B‐Fc and T‐Fc. K D, k on, and k off values are presented. (C) BLI comparison of B‐Fc and T‐Fc interaction with FGFR1. The extracellular region of FGFR1 was immobilized on BLI sensors and incubated either with B‐Fc or T‐Fc. The association and dissociation profiles were measured. (D) Upper panel, B‐Fc and T‐Fc interaction with FGFR1 on model cells. U2OS‐R1 cells stably producing FGFR1 were incubated with B‐Fc or T‐Fc on ice to prevent internalization of receptor–antibody complexes, or briefly at room temperature. Nuclei were labeled with NucBlue Live; cells were washed, and fixed; and bound antibodies were visualized with Zenon AF‐488 using fluorescence microscopy. Scale bars represent 20 µm. Lower panel, quantification of T‐Fc and B‐Fc cell binding at room temperature performed using zen 2.3 software based on three independent experiments. The signal of B‐Fc was set to 100%, and average intensity of T‐Fc in relation to B‐Fc ±SD was shown. (E) BN‐PAGE analysis of FGFR1 complexes with engineered antibodies. FGFR1‐Fc (0.1 μm) was incubated with B‐Fc (0.2 μm, 1 μm) and T‐Fc (0.2 μm, 1 μm), and proteins were separated on 4–10% BN‐PAGE gels and detected by western blotting.
