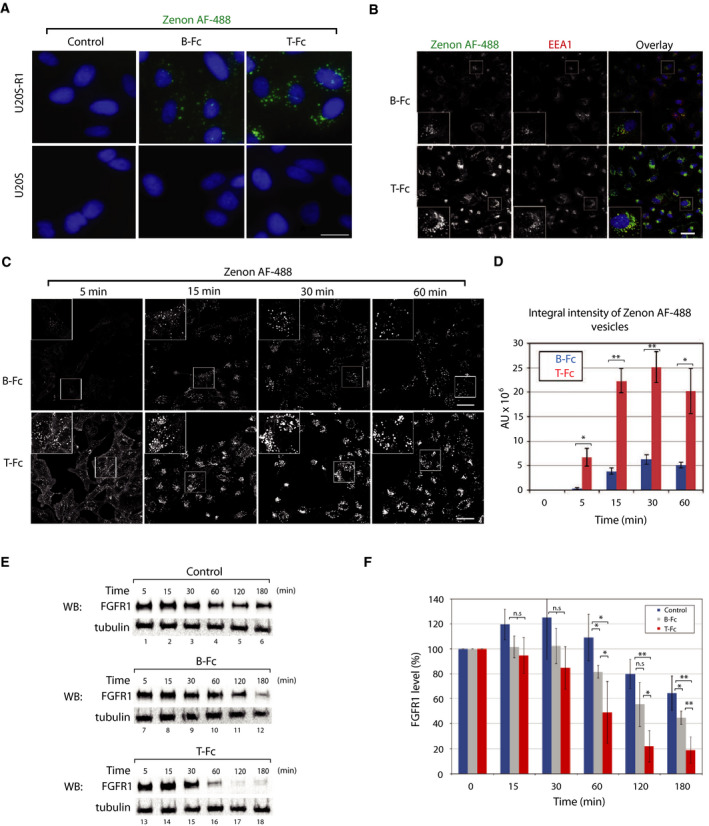
Fig. 4.

The differential influence of T‐Fc and B‐Fc on FGFR1 internalization. (A) Engineered antibodies are internalized via FGFR1‐dependent endocytosis. U2OS‐R1 cells stably expressing FGFR1 and U2OS cells (control cell line with negligible level of FGFR1) were incubated with 100 nm of B‐Fc and T‐Fc for 30 min. Nuclei were stained with NucBlue Live, cells were fixed, and internalized antibodies were visualized with Zenon AF‐488 using wide‐field fluorescence microscope. Scale bar represents 20 µm. (B) Internalized T‐Fc and B‐Fc are present in endosomes. U2OSR1 cells were incubated with 100 nm B‐Fc and T‐Fc for 15 min, cells were fixed, internalized antibodies were labeled with Zenon AF‐488, and early endosome marker protein EEA1 was detected with immunolabeling. Cells were analyzed with confocal microscopy. Scale bar represents 50 µm. (C) Confocal microscopy analysis of the kinetics of B‐Fc and T‐Fc internalization. U2OSR1 cells were incubated with 100 nm B‐Fc and T‐Fc for different time periods, and internalized antibodies were labeled with Zenon AF‐488 and analyzed with confocal microscopy. Scale bar represents 50 µm. (D) Quantification of B‐Fc and T‐Fc internalization (expressed as integral fluorescence intensity in arbitrary units, AU) using the harmony software. Mean values of three independent experiments of integral intensity of Zenon AF‐488 vesicles ±SEM are shown. T‐test was used to assess the statistical significance of measured differences in internalization; *P < 0.05, **P < 0.005. (E) Engineered antibodies induce FGFR1 degradation. U2OS‐R1 cells were serum starved, treated with cycloheximide to inhibit synthesis of new FGFR1 pool, and incubated with equimolar concentrations of B‐Fc and T‐Fc for various time points, or left untreated (control). Cells were lysed, and the level of FGFR1 was determined with western blotting (WB). Tubulin detection was used as an indication of equal loading. Representative results from four independent experiments are shown. (F) Quantitative analyses of FGFR1 degradation (Fig. 4E) upon stimulation with engineered antibodies. FGFR1 band intensities were quantified and corrected for loading differences (intensity of tubulin bands). Average values from four independent experiments ±SD are shown. T‐test was used to assess the statistical significance of measured differences in FGFR1 levels,*P < 0.05, **P < 0.005, n.s.—not significant.
