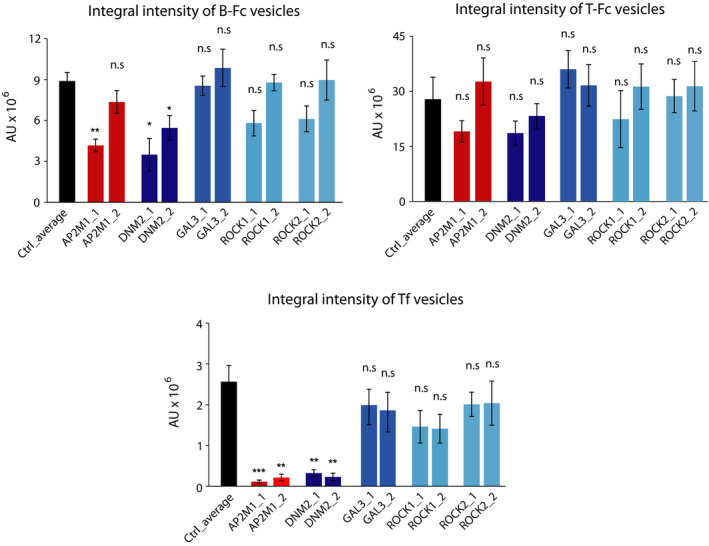
Fig. 8.

Quantitative analyses of B‐Fc and T‐Fc internalization upon inhibition of clathrin‐independent endocytic pathways. Quantification of engineered antibodies internalization. Cells were treated as in Figs 6 and 7, Fig. S1 and S2, and the efficiency of B‐Fc, T‐Fc, and transferrin internalization (expressed as integral fluorescence intensity in arbitrary units, AU) was assessed with the harmony software. Average values from three independent experiments ±SEM are shown. T‐test was used to assess the statistical significance of measured differences,*P < 0.05, **P < 0.005, n.s.—not significant.
