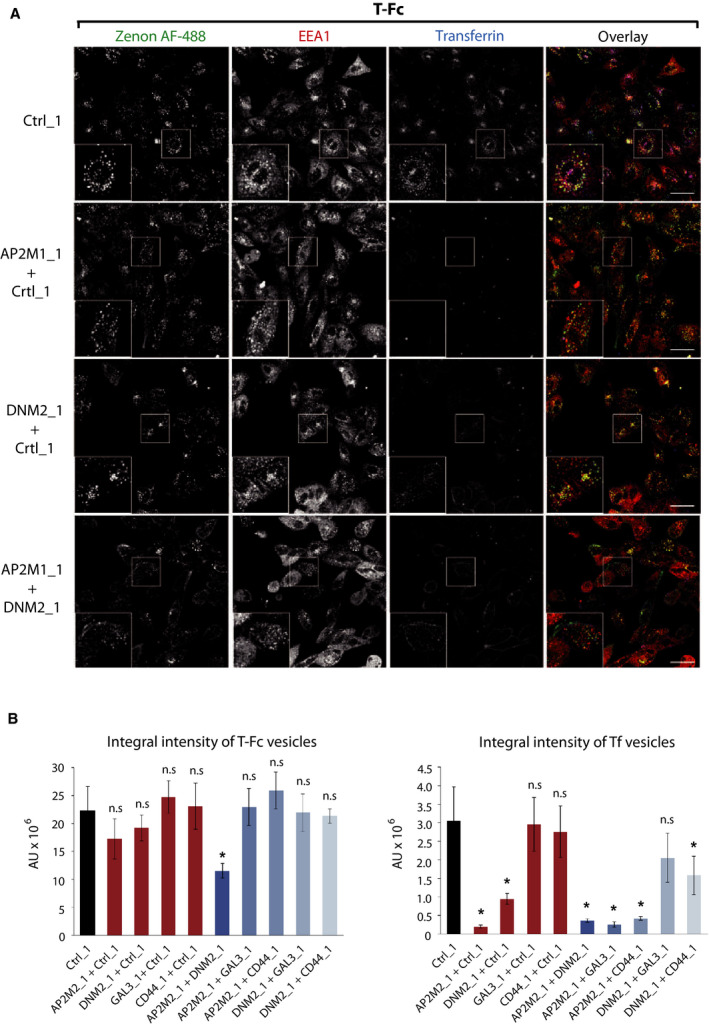
Fig. 9.

Different endocytic routes mediate cellular uptake of T‐Fc. (A) Representative confocal microscopy images of U2OS‐R1 cells showing the effect of simultaneous depletion of AP2µ2 (AP2M1) and dynamin‐2 (DNM2) on the internalization of T‐Fc. Cells were incubated for 60 min with 100 nm T‐Fc and fluorescently labeled transferrin as an internal control of CME inhibition. Internalized T‐Fc was visualized with Zenon AF‐488, and its co‐localization with immunolabeled EEA1 was determined using confocal microscopy. Scale bars represent 50 µm. (B) Quantification of internalization of the engineered antibodies upon double‐depletion of different endocytic proteins. The efficiency of T‐Fc and transferrin internalization (expressed as integral fluorescence intensity in arbitrary units, AU) was assessed with harmony software. Average values from three independent experiments ±SEM are shown. T‐test was used to assess the statistical significance of measured differences; *P < 0.05, **P < 0.005, n.s.—not significant.
