
Fig. 3.
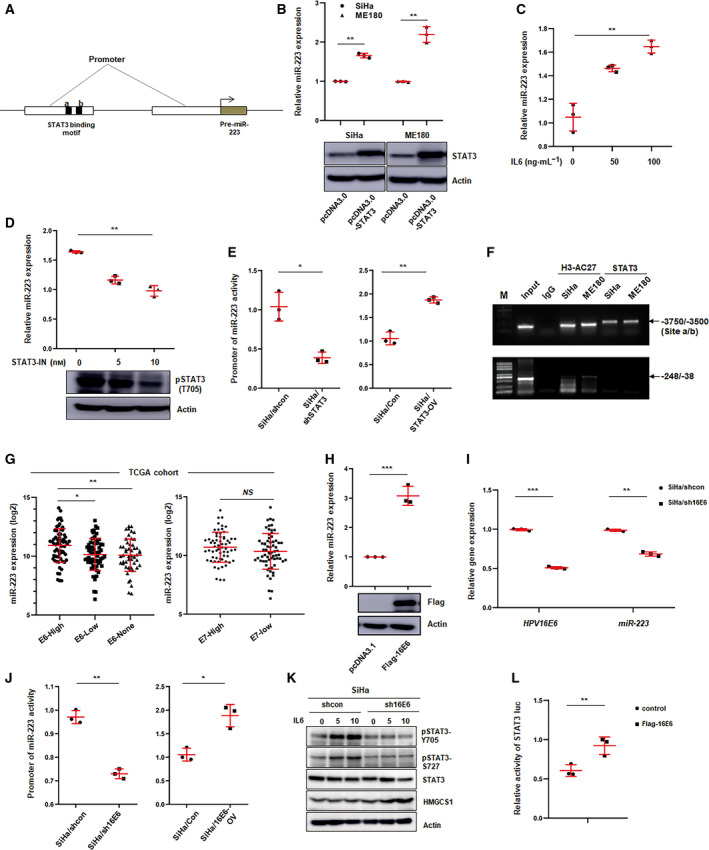
E6 regulates miR‐223 expression through affecting STAT3 activity in CSCC cells. (A) Schematic illustrating the distal and proximal promoters of pre‐miR‐223 gene, and two putative STAT3‐binding motifs on the distal promoter. (B) qPCR analysis of miR‐223 level in CSCC cells transfected with control or STAT3 overexpression plasmids. Blot showed the STAT3 expression in transfected SiHa or ME180 cells. Data represent mean ± SD from three independent experiments. (C–D) miR‐223 level was determined by qPCR in SiHa cells treated with IL‐6 (C) or STAT3 inhibitor (D) at the indicated concentration. Blot showed the level of phosphorylated STAT3 (Tyr 705) in treated cells. Data represent mean ± SD from three independent experiments. (E) Luciferase reporter assay analysis of the activity of miR‐223 promoter in STAT3 knockdown (left) or overexpression (right) and corresponding control cells. Data represent mean ± SD from three independent experiments. (F) ChIP assay analysis of the binding of STAT3 on miR‐223 promoter. The enrichment fragments pulled down by anti‐STAT3 antibody were analyzed by agarose gel electrophoresis. H3‐AC27 (anti‐Acetylated H3K27) served as positive control. These results represent one of three independent experiments. (G) miR‐223 expression was analyzed in indicated groups defined by HPVs E6 or E7 level in TCGA cohort. (H) miR‐223 level was determined by qPCR in E6 overexpression or control cells. The blot showed E6 expression in transiently transfected SiHa cells with pCMV‐Flag‐E6 plasmids by incubated with anti‐Flag antibody. These results represent one of three independent experiments. (I) miR‐223 expression was examined by qPCR in E6 knockdown or control cells. The efficiency of knockdown of E6 was shown as left. (J) Luciferase reporter assay of the activity of miR‐223 promoter in E6 knockdown (left) or overexpression (right) and corresponding control cells. (K) Western blot analysis of phosphorylated STAT3 (Tyr705 and Ser727) in E6 knockdown or control cells treated with IL‐6 as indicated concentration. (L) Luciferase reporter assays of STAT3 activity in 293T cells transiently transfected with control or pCMV‐Flag‐E6 plasmids. Briefly, STAT3‐luc (100 ng·well−1) and pRL (50 ng·well−1) were cotransfected with control or pCMV‐Flag‐E6 (100 ng·well−1) into 293T cells (1 × 10⁵ per well, 48‐well plates), respectively. After 48 h, luciferase activity was determined by dual‐luciferase reporter assay. Data represent mean ± SD from three independent experiments. Data were statistically analyzed with Student's t‐test, and value was shown as mean ± SD. *P < 0.05, **P < 0.01, ***P < 0.001.