
Fig. 5.
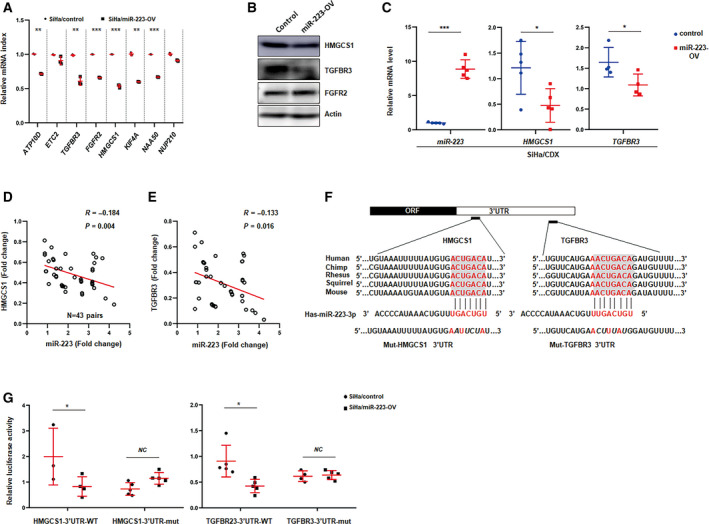
Prediction and validation of TGFBR3 or HMGCS1 as the targets of miR‐223. (A) qPCR analysis of predicated targets of miR‐223 in control or miR‐223 overexpression cells. (B) Western blot analysis of HMGCS1, TGFBR3, or FGFR2 in control or miR‐223 overexpression cells. Actin served as loading control. Blots represent one of three independent experiments. (C) qPCR analysis of the level of TGFBR3 and HMGCS1 of tumors form the implanted mice as indicated. Data represent mean ± SD from three independent experiments. (D, E) Spearman rank correlation scatter plot of the staining score in miR‐223 levels and TGFBR3 levels (D), HMGCS1 levels (E) in CSCC tissues (n = 43). (F) Schematic illustrating the highly conserved binding sites for miR‐223 in the 3′ UTR of TGFRB3 and HMGCS1 mRNA and mutation of the indicated nucleotides in seed sequences. (G) Luciferase reporter assays of the effects of the miR‐223 on wild‐type and mutant reporter genes in SiHa cells. Data represent mean ± SD from three independent experiments. *P < 0.05, **P < 0.01, ***P < 0.001.