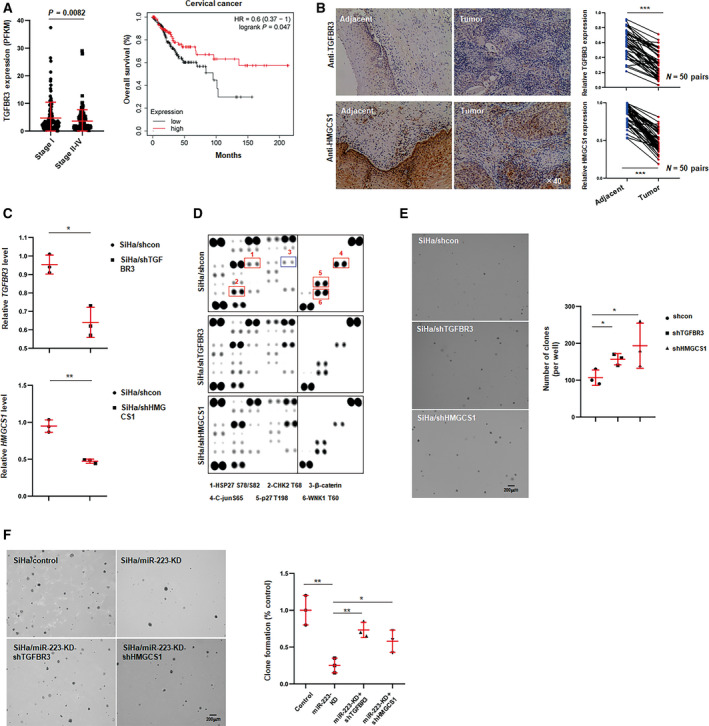
Fig. 6.

TGFBR3 or HMGCS1 inhibits cervical cancer cell growth and colony formation. (A) Expression value of TGFBR3 was analyzed in indicated stages of CSCC tissues in TCGA cohort, and right was the overall survival rate in TGFBR3‐high or TGFBR3‐low groups. (B) Representative image of IHC staining for TGFBR3 and HMGCS1 of CSCC tissues and matched adjacent tissues (n = 50). Mircrographs were shown at original magnifications (×40). IHC score of TGFBR3 and HMGCS1 was shown in right, and the data were shown as the mean ± SD. (C) The efficiency of knockdown of TGFBR3 and HMGCS1 was determined by qPCR in stable transfected cells. (D) Phospho‐kinase assays of the effect of TGFBR3 or HMGCS1 on intrinsic pathways in SiHa cells. (E) Anchor‐independent growth assays of the effect of TGFBR3 and HMGCS1 on colony formation of SiHa cells. Statistic result was shown in right. Data were shown as the mean ± SD. Data represent one of three independent experiments. (F) Representative image of colony formation for double knocking down miR‐223 and TGFBR3 or HMGCS1 in SiHa cells. Statistic result was shown in right. Data were shown as the mean ± SD. *P < 0.05, **P < 0.01, ***P < 0.001.
