
Fig. 1.
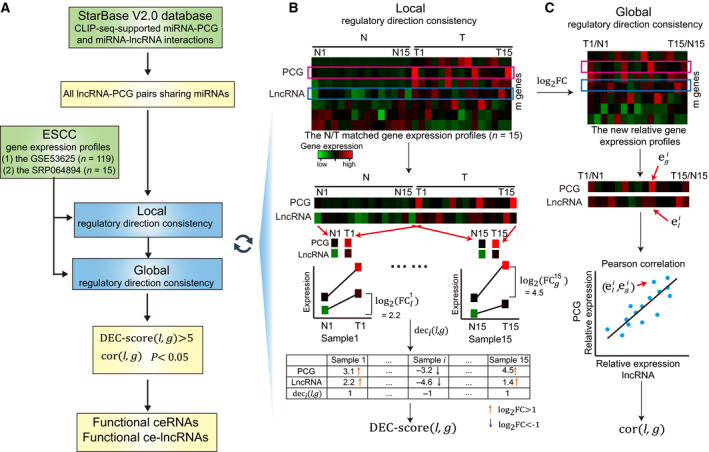
Schematic overview of the GloceRNA method. (A) Flow diagram of GloceRNA. The lncRNA‐PCG pairs sharing miRNA target sites are first established using CLIP‐seq‐supported miRNA‐PCG and miRNA‐lncRNA interactions. Next, GloceRNA calculates the local and global regulatory direction consistency of each lncRNA‐PCG pair. Finally, GloceRNA tests whether each lncRNA‐PCG pair meets the local and global direction consistency criteria. A lncRNA‐PCG pair sharing miRNAs will be identified as a functional ceRNA if it meets the two direction consistency criteria. The related lncRNA will be identified as a functional ce‐lncRNA. (B) Schematic overview of local regulatory direction consistency of expression of ceRNAs. (C) Schematic overview of global regulatory direction consistency of expression of ceRNAs. N, normal; T, tumor. DEC score(l, g): local regulatory direction consistency score of the lncRNA‐PCG pair, which can effectively evaluate possibility of ceRNAs significantly appearing in samples. deci(l, g): the expression consistency score of the lncRNA‐PCG pair in the sample i, which represents the regulatory direction consistency of expression at single sample level. cor(l, g): global regulatory direction consistency score of the lncRNA‐PCG pair, which is calculated using Pearson correlation coefficient of lncRNA‐PCG. P: P value of Pearson correlation coefficient. and : log2FC value of gene expression of lncRNA l and PCG g in sample i, which represent the relative gene expression level of tumor minus normal. and .