Fig. 2.

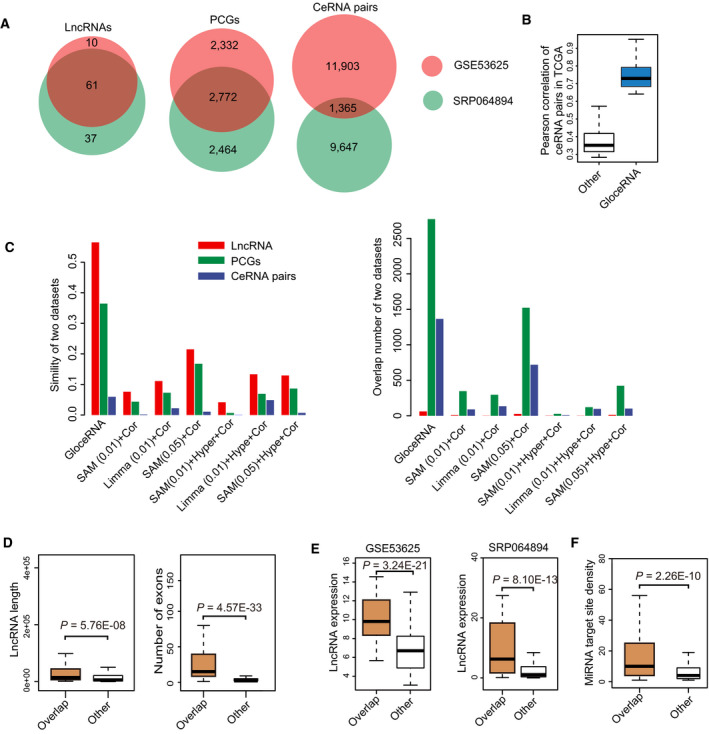
Identification and analysis of functional ce‐lncRNAs in ESCC. (A) Venn diagram showing the overlap of lncRNAs (left), PCGs (middle), and ceRNA pairs (right) between both ESCC datasets (GSE53625 and SRP064894). (B) Box plots of expression correlation of ceRNA pairs in TCGA ESCC samples. The bars represent expression of ceRNA pairs (blue) and all background pairs (write). (C) Comparison of results between our method and other methods. Left panel shows overlap similarity of lncRNAs (red), PCGs (green) and ceRNA pairs (blue). Right panel shows overlap number of lncRNAs (red), PCGs (green), and ceRNA pairs (blue). Traditionally, a lncRNA‐PCG pair sharing miRNAs will be defined as functional ceRNA relationship based on the following criteria: (a) Expression correlation of lncRNA‐PCG pair (Cor); (b) Shared miRNAs (Hyper); and (c) Differentially expression level of lncRNAs/PCGs (SAM or Limma). We used six different combinations of them for fair comparison with our method, including SAM(0.01)+Cor, Limma(0.01)+Cor, SAM(0.05)+Cor, SAM(0.01)+Hyper+Cor, Limma(0.01)+Hype+Cor, and SAM(0.05)+Hype+Cor. Box plots of ce‐lncRNAs are displayed according to (D) Length (left) and number (right) of exons, (E) expression level, and (F) number of miRNA target sites. GSE53625 represents the GSE53625 (n = 119) dataset.
