Fig. 5.

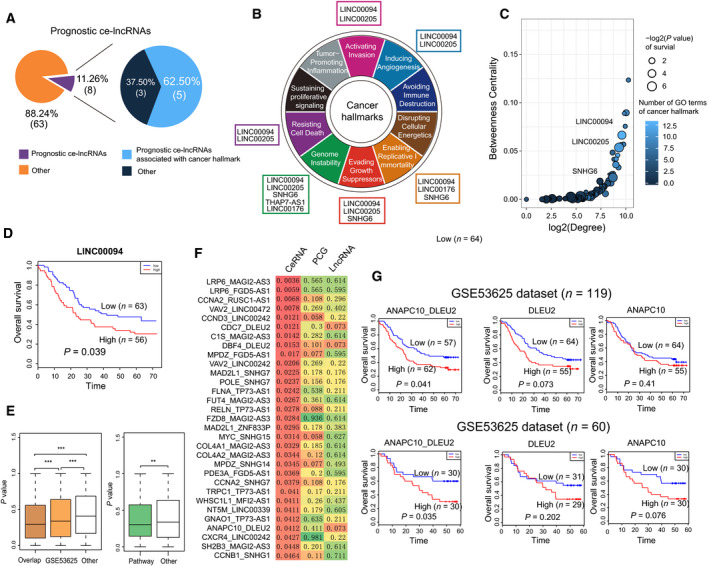
Prognostic analysis of ce‐lncRNAs. (A) The pie charts show the proportion of prognostic ce‐lncRNAs (covered by cancer hallmarks). (B) Diagram of the ten hallmarks of cancer adapted from Hanahan and Weinberg (2011). The prognostic ce‐lncRNAs were assigned to hallmark categories based on GO terms enriched by ce‐lncRNA‐related PCGs. (C) The summary bubble plot showing the relationships between topological feature and number of hallmark GO terms of SE‐associated lncRNAs. X‐ and y‐axis represent degree and betweenness of ce‐lncRNAs in the ceRNA network. The bubble size indicates number of hallmark GO terms. (D) Kaplan–Meier survival curves of patients with ESCC classified into high‐ and low‐risk groups based on the signature of lncRNA LINC00094. (E) Left panel: box plots of the lncRNA‐PCG ceRNA pairs from pairs in the conservative ceRNA network (overlap), pairs identified by GSE53625 (n = 119), as well as other random pairs. Right panel: box plots of the lncRNA‐PCG ceRNA pairs annotated to functional pathways. P values were calculated using Wilcoxon rank‐sum test. *P < 0.05, **P < 0.01, ***P < 0.001. (F) The lncRNA‐PCGs ceRNA pairs that distinguish ESCC patients better than the corresponding single gene. This means that the ceRNA pair using the log‐rank test with P values < 0.05 was identified significant, whereas individual lncRNA and PCG were not significant. Color was related to P values. (G) Kaplan–Meier survival curves of ESCC patients the GSE53625 (n = 119) and GSE53625 (n = 60) datasets that were classified into high‐ and low‐risk groups based on ceRNA pair signature, as well as their corresponding lncRNA and PCG.
