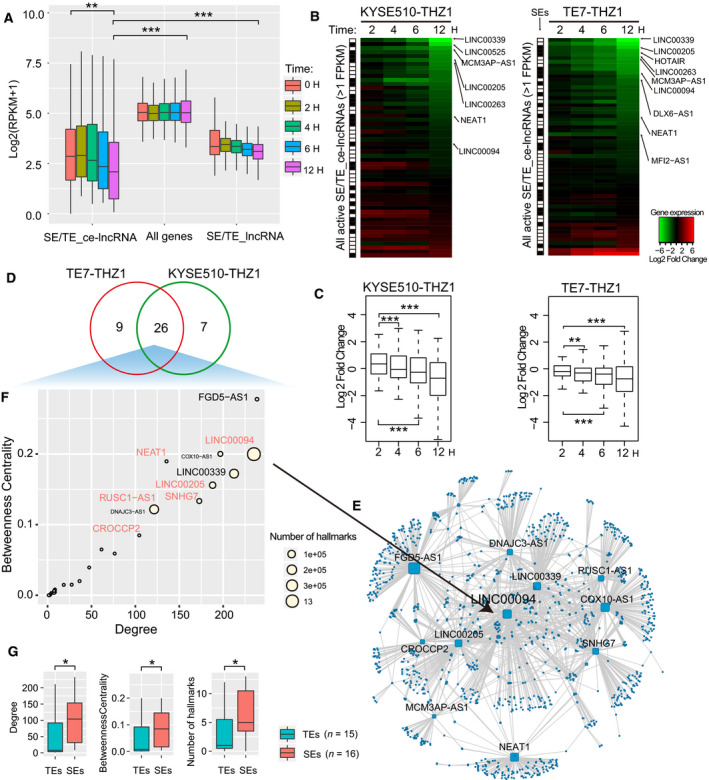
Fig. 7.

Inhibition of THZ1 for SE/TE‐associated ce‐lncRNAs. (A) Boxplot of expression of enhancer associated ce‐lncRNAs upon either DMSO or THZ1 (50 nm) at indicated time points. (B) Heatmap showing expression changes (log2 fold changes) of all active TE/TE‐associated ce‐lncRNAs upon either DMSO or THZ1 (50 nm) at indicated time points. (C) Box plots of log2 fold changes in global lncRNA expression in KYS510 and TE7 cells treated with either DMSO or THZ1 (50 nm) at indicated time points. (D) Venn diagram showing the overlap between SE/TE‐associated ce‐lncRNAs from KYS510 and TE7 cells which decreased over 1.5‐fold at 12 h. The overlapped lncRNAs were defined as THZ1‐sensitive SE/TE‐ce‐lncRNAs. (E) A THZ1‐sensitive ceRNA network that is constructed using THZ1‐sensitive SE/TE‐ce‐lncRNAs and their related PCGs. (F) The summary bubble plot showing the relationships between topological feature and number of hallmark GO terms of SE‐associated lncRNAs. X‐ and y‐axis represent degree and betweenness of THZ1‐sensitive SE/TE‐ce‐lncRNAs in the THZ1‐sensitive ceRNA network. The bubble size indicates number of hallmark GO terms. (G) Comparison between SE‐associated and SE‐associated THZ1‐sensitive ce‐lncRNAs, including degrees and betweenness in the THZ1‐sensitive ceRNA network, as well as the number of cancer hallmark GO terms.
