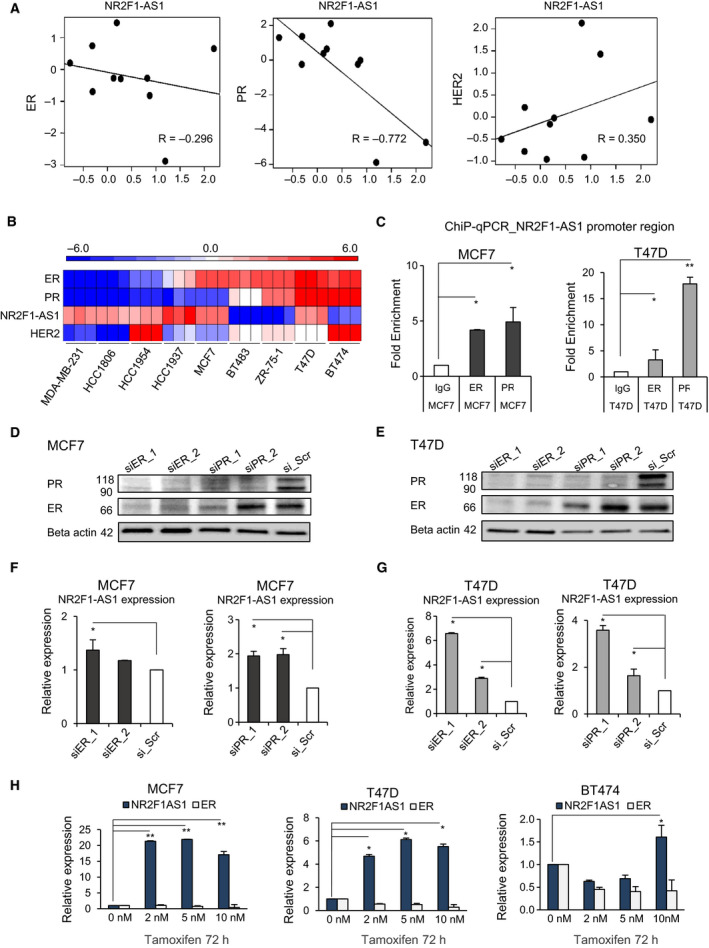
Fig. 4.

Progesterone receptor and ER govern NR2F1‐AS1 expression. (A) Pearson correlation of ER, PR, and HER2 with NR2F1‐AS1 restricted to recurrence samples based on microarray samples. (B) Heatmap showing the expression levels of ER, PR, NR2F1‐AS1, and HER2 in a series of breast cancer cell lines of different origin based on qPCR. (C) ChIP‐qPCR for the enrichment of ER and PR in the promoter region of NR2F1‐AS1. Normal rabbit IgG is shown as a negative control. (D, E) Transient silencing of ER and PR for 72 h with siRNA in MCF7 (D) and T47D (E). Two different siRNA sequences were used for each receptor. Scramble siRNA (siR_Scr) is shown as a negative control. (F, G) Relative expression levels of NR2F1‐AS1 upon transient knockdown of ER and PR. (H) Relative expression levels of NR2F1‐AS1 and ER after the administration of low doses of tamoxifen for 72 h (n = 3 in triplicate; Student’s t‐test, *P < 0.01, **P < 0.001). Error bars: mean ± SD.
