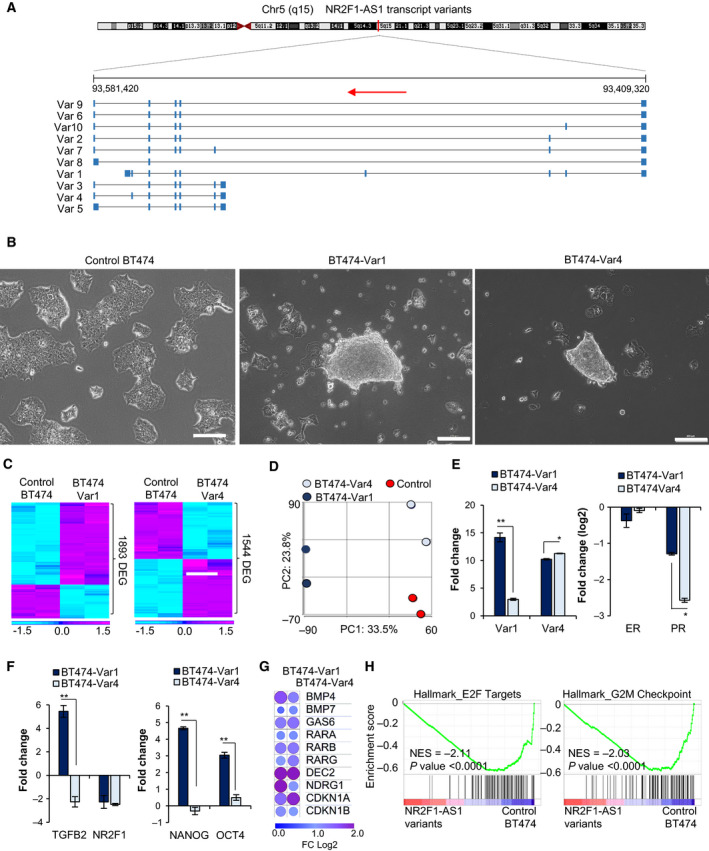
Fig. 5.

Gain of function of NR2F1‐AS1 Var1 and Var4 induce dormancy. (A) Illustration of the genomic sequence of Homo sapiens NR2F1‐AS1 and its transcript variants (indicated as Var). NC_000005.10 chromosome 5q15 GRCh38.p12. Source: NCBI Gene. (B) Morphological changes induced by the overactivation of NR2F1‐AS1 Var1 and Var4 in BT474 cells. Transfected variant and control BT474 cells underwent antibiotic selection for 20 days and were maintained in antibiotic‐free medium thereafter. Scale bars: 200 μm. (C) Heatmap based on DEG in Control BT474 cells versus BT474‐Var1 and BT474‐Var4 cells (n = 2 replicates, 2‐fold increase, P < 0.05). (D) PCA of the whole transcriptomes of Control BT474, BT474‐Var1, and BT474‐Var4 cells. (E, F) qPCR analysis of the fold change in expression levels (n = 3 in triplicate; Student’s t‐test, *P < 0.01, **P < 0.001). Fold changes are shown by comparing with control cells. Error bars: mean ± SD. (G) Heatmap based on dormancy related factors found in BT474‐Var1 and BT474‐Var4 cells, shown as log2 fold change. (H) Functional enrichment analysis by GSEA for BT474‐Var1 and BT474‐Var4 cells (in combination) versus Control BT474 cells (P < 0.05).
