
Fig. 6.
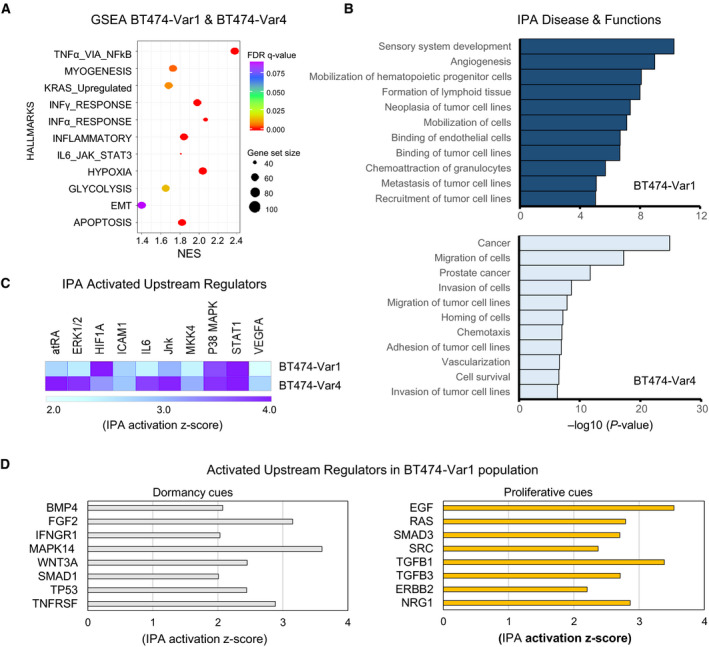
NR2F1‐AS1 promotes events of the metastatic cascade. (A) Functional enriched pathways in BT474‐Var1 and BT474‐Var4 cells by GSEA. Data are presented as FDR value, gene set size (50–100), and NES (normalized enrichment score). (B) Ingenuity pathway analysis (IPA) of biological functions and diseases. Selected biological functions are shown. Top, BT474‐Var1, and bottom, BT474‐Var4. (C) IPA for upstream regulators showing similarly activated regulators in BT474‐Var1 and BT474‐Var4 cells. (D) IPA of the activation of upstream regulators in BT474‐Var1 cells. Representing patterns of dormant (left) and proliferative (right).