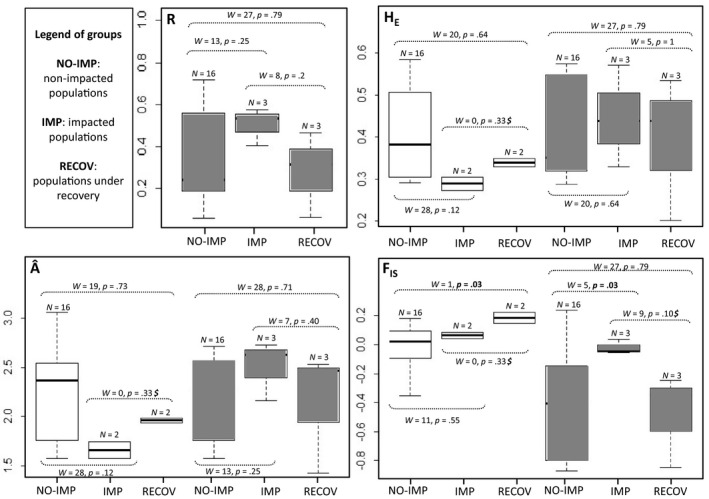
FIGURE 2.

Comparisons of clonal richness (for the cultivated populations) and genetic diversity in groups of populations: populations mostly not impacted by the earthquake (NO‐IMP), populations sampled 1 month after being severely impacted by all the earthquake perturbations (IMP), and recovering populations sampled more than 2 years after the earthquake occurrence (RECOV). White boxes correspond to groups of natural populations and gray ones to farmed populations. The values of W, the statistic of the Mann–Whitney Wilcoxon's ranking test are provided
