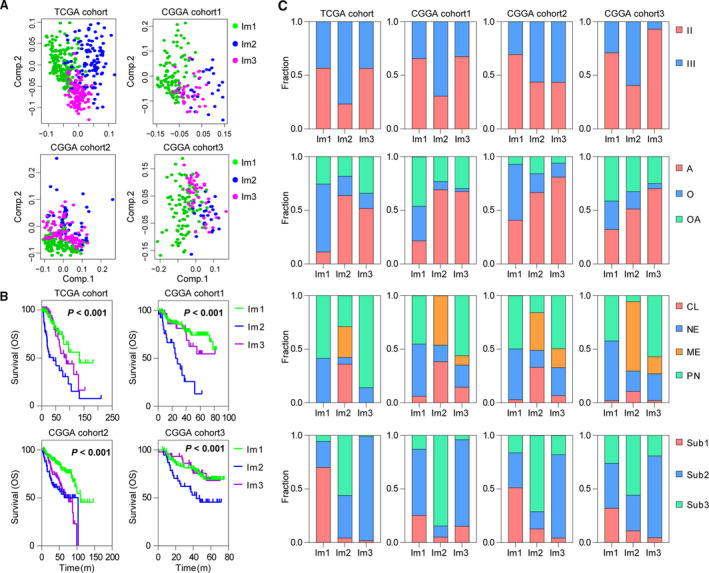
Fig. 2.

Three immune subtypes show distinct pathologic features and outcome in TCGA and CGGA cohorts. (A) PCA of three immune subtypes using 626 genes in TCGA and CGGA cohorts. (B) The Kaplan–Meier analysis of immune subtypes based on OS. P value was calculated by the log‐rank test among subtypes. (C) Bar plots show the proportion of tumors stratified by pathologic features within immune subtypes. CL, classical; ME, mesenchymal; NE, neural; PN, proneural. A, astrocytoma; O, oligodendroglioma; OA, oligoastrocytoma. Sub1: IDH mutant and 1p/19q codeleted, Sub2: IDH mutant and 1p/19q non‐codeleted, Sub3: IDH wild‐type.
