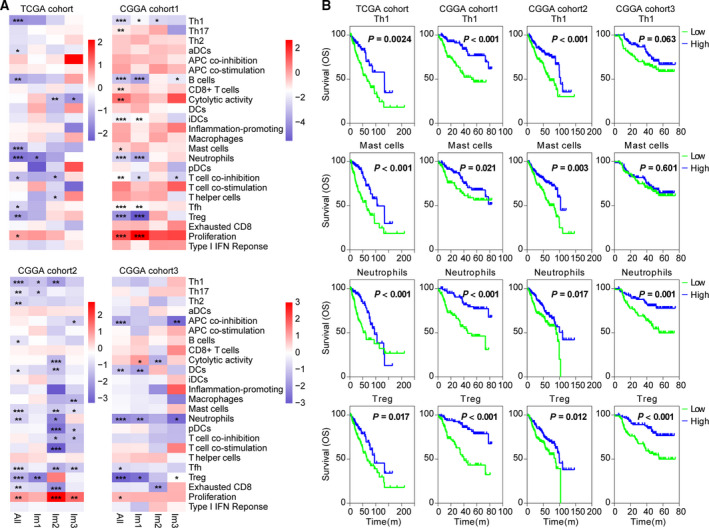
Fig. 4.

Immune cell signatures were associated with clinical outcome of diffuse LGG. (A) Heatmaps show hazard ratios for immune expression signature scores in relation to v within immune subtypes. Correlation of OS was assessed by Cox regression analysis. *P < 0.05; **P < 0.01; and ***P < 0.001. (B) The Kaplan–Meier analyses of tumors stratified by Th1, mast cell, neutrophil, and Treg scores in TCGA and CGGA cohorts. P value was calculated by the log‐rank test.
