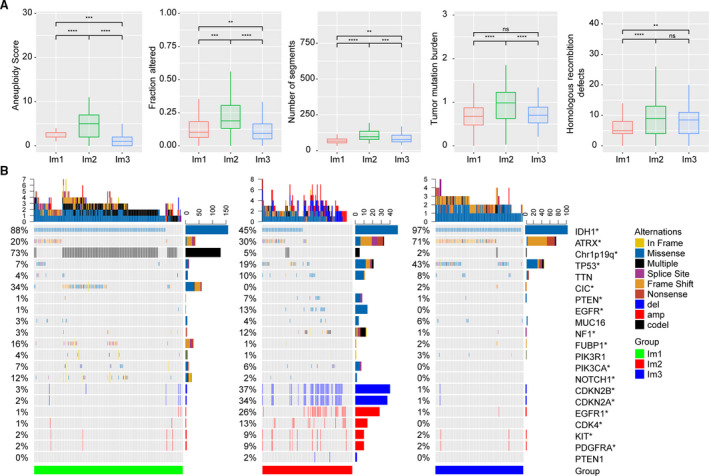
Fig. 5.

Genomic alterations within immune subtypes of TCGA cohort. (A) Comparison of DNA damage measures within immune subtypes of TCGA cohort (t‐test). Error bars show standard error of the mean, and the middle bar represents the median level of corresponding features. (B) Differential somatic mutations and copy‐number variations analyses within three immune subtypes (Fisher test). *P < 0.05; **P < 0.01; ***P < 0.001; and ****P < 0.0001.
