
Fig. 6.
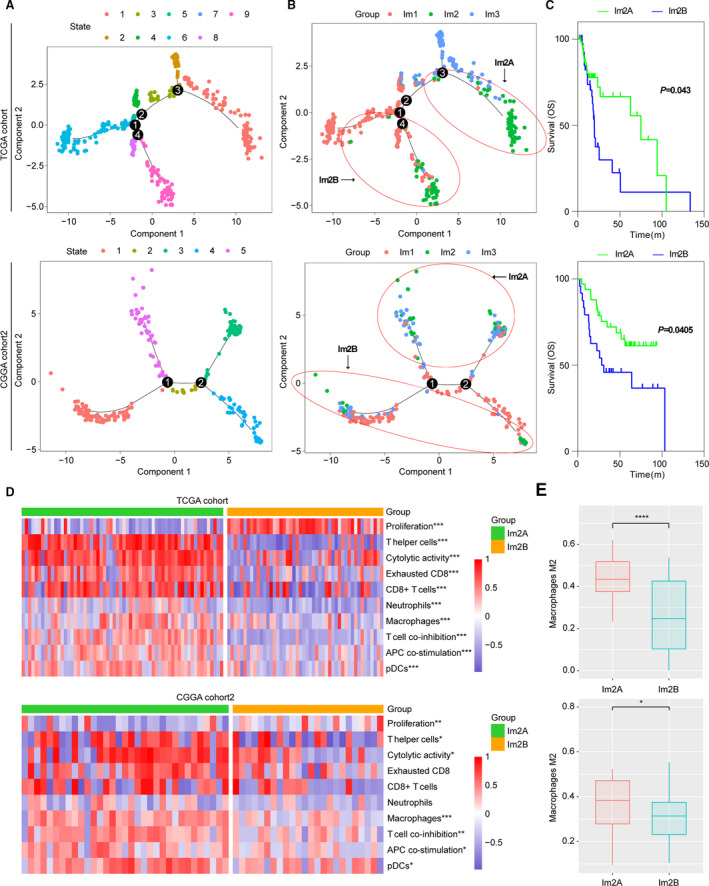
The intracluster heterogeneity revealed by the immune landscape analysis in TCGA cohort and CGGA cohort 2. (A, B) Graph learning‐based dimensionality reduction analysis to the immune gene expression profiles with colored state and immune subtypes. Each point represents a patient with colors corresponding to state and immune subtypes. (C) The Kaplan–Meier analysis of two Im2 subtypes based on OS. P value was calculated by the log‐rank test. (D) Hierarchical clustering of GSVA signature scores (t‐test). (E) Comparison of M2 macrophage proportion (from CIBERSORT) between Im2A and Im2B (t‐test). Error bars show standard error of the mean, and the middle bar represents the median level of corresponding feature. * P < 0.05; **P < 0.01; and ***P < 0.001.