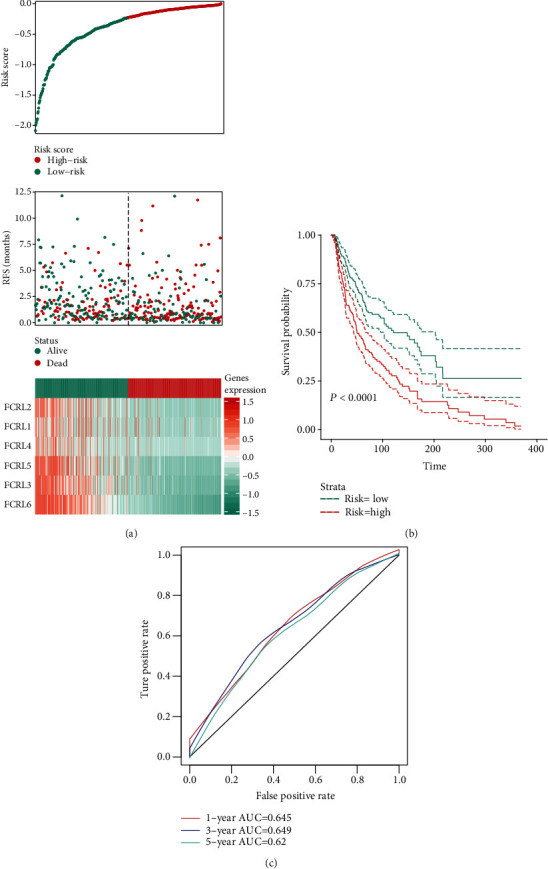
Figure 3.

Establishment of FCRL OS prediction value in the TCGA-CM cohort. (a) Risk score for each patient in TCGA-CM cohort and heatmap to show the expression of FCRL1-6. (b) The K-M plot showing the different OS outcome in high-risk and low-risk groups. (c) ROC curve showing the AUC value in 1-year, 3-year, and 5-year predicted accuracy.
