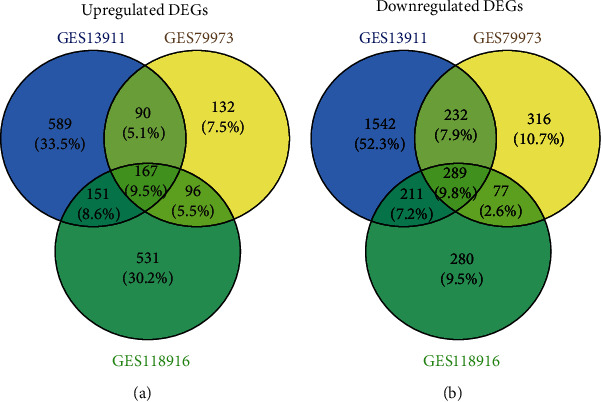
Figure 1.

The identification of DEGs in the three data sets (GSE13911, GSE79973, and GSE118916). (a) Upregulated DEGs. (b) Downregulated DEGs. Different color regions represented different data sets. Overlapping areas are commonly DEGs. The cutoff criteria: ∣logFC | >1.0 and adj. p value < 0.05. DEGs: differentially expressed genes.
