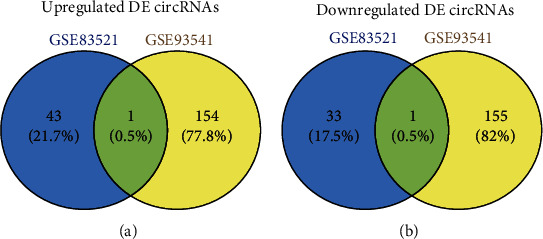
Figure 5.

The identification of DE-circRNAs in the two data sets (GSE83521 and GSE93541). (a) Upregulated DE-circRNAs. (b) Downregulated DE-circRNAs. Different color regions represent different data sets. Overlapping areas are commonly DE-circRNAs. The cutoff criteria: ∣logFC | >1.0 and adj. p value < 0.05. DE-circRNAs: differentially expressed circRNAs.
