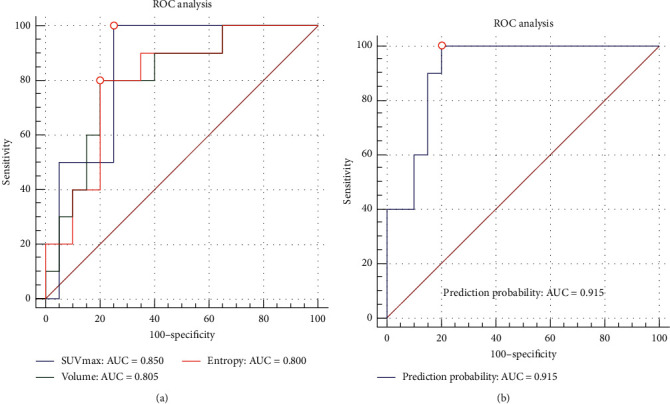
Figure 2.

ROC analysis of parameters with AUCs ≥0.800 and the prediction probability. (a) ROC analysis of the SUVmax, volume, and entropy. The AUCs were 0.850, 0.805, and 0.800, respectively. (b) ROC analysis of the prediction probability generated from the combination of the SUVmax, entropy, volume, and intestinal involvement. The AUC was 0.915.
