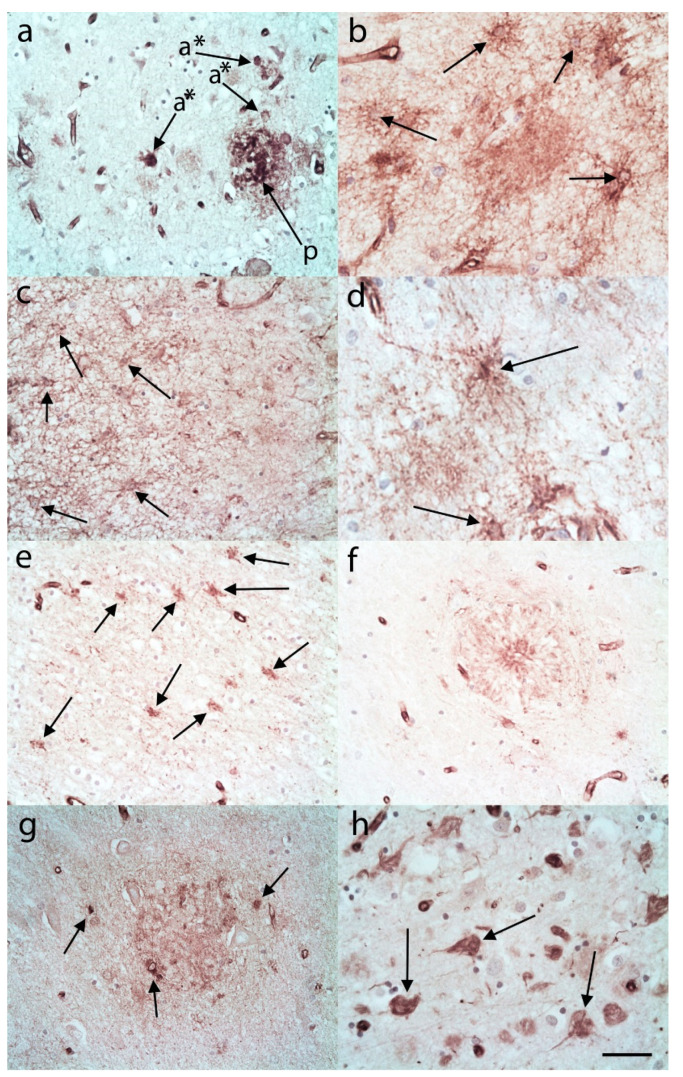
Figure 5.
S100A10 immunohistochemistry in Alzheimer’s disease cases labelled in (a) the upper frontal cortex plaques (p, arrows) and numerous ASLCs (a *, arrows). (b) There were also numerous S100A10 immunopositive ASLCS not adjacent to plaques in the upper frontal cortex (arrows). (c) These S100A10 immunopositive ASLCs were also evident in the upper temporal cortex (arrows). (d) The lower frontal cortex revealed moderate to large numbers of S100A10 immunopositive ASLCs (arrows) and they were numerous in the frontal white matter (e, arrows). Occasional S100A10 immunopositive plaques were evident in the CA4 region of the hippocampus (f). There were variable numbers of S100A10 immunopositive ASLCs also seen in this CA4 region of the hippocampus (g, arrows). (h) S100A10 immunohistochemistry labelled occasional neurofibrillary tangles (arrows). Anti-S100A10. Original magnifications (a–e) and (g) ×40 (NA 0.9), (f,h) ×60 (NA 0.9). Scale Bar (a) −75 µm, (b,d,e,g) −40 µm, (c,f,h) −50 µm.

