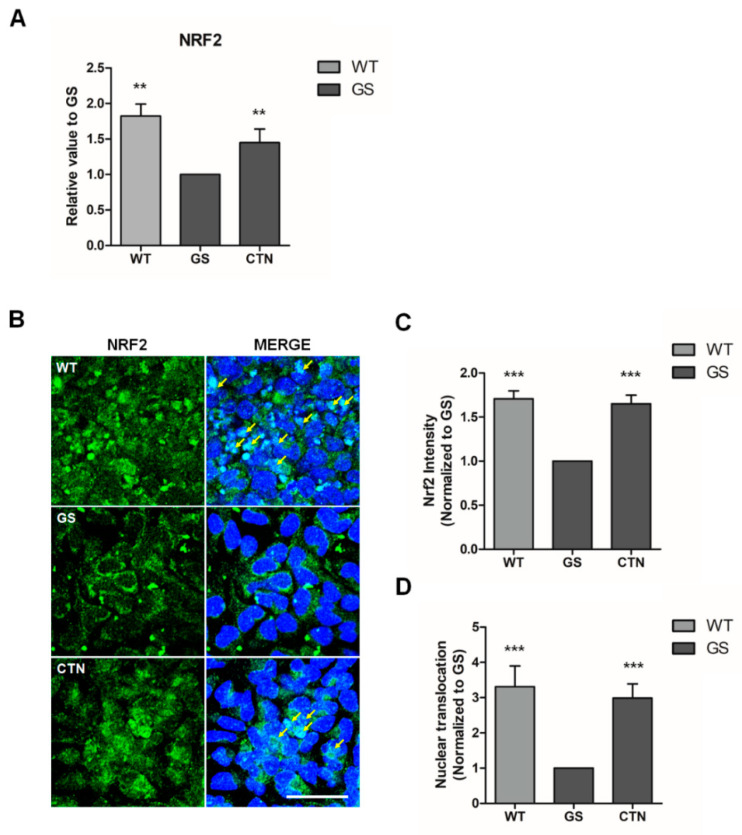
Figure 5.
Expression and sub-cellular localization of nuclear factor erythroid 2-related factor 2 (NRF2) in an in vitro PD model. (A) mRNA expression of NRF2—the master regulator of antioxidant responses. (B) Immunofluorescence analysis of NRF2 labeled by Fluorescein (FITC, green). Cell nuclei were stained with Hoechst33342 (blue). Scale bar is 20 µm. (C) Intensities of NRF2 expression. (D) Quantification of NRF2 nuclear translocation. Data are mean ± standard error of means (SEM) of at least three independent experiments. p-values were analyzed using the unpaired two-tailed Student’s t-test (** p < 0.005, *** p < 0.001).

