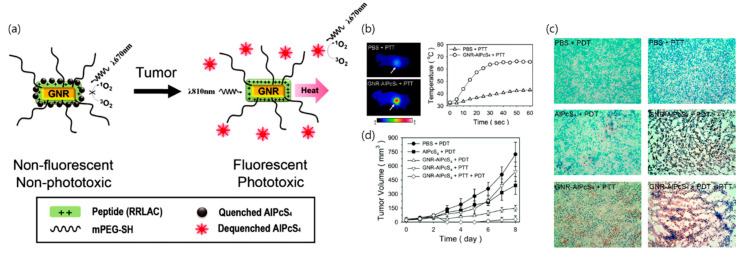
Figure 3.
In vivo PTT and PDT. (a) The PEG-gold nanorod-RRLAC/Al(III) phthalocyanine chloride tetrasulfonic acid (GNR-AlPcS4) complex for NIR fluorescence imaging and tumor phototherapy; (b) Thermographic images captured after 1 min of light illumination, and thermographic monitoring in the tumors of GNR-AlPcS4-injected and PBS-injected mice; (c) TUNEL staining of the tissue sections (magnification × 20). Normal or apoptotic cell nuclei are shown in green and brown, respectively. Empty areas in the tissue sections (GNR-AlPcS4 complex + PDT and GNR-AlPcS4 complex + PTT + PDT) are due to washout of the destroyed tumor cells during the staining procedure; (d) Tumor size in each treatment group by the indicated days. Points, mean; bars, standard deviation. PBS + PDT (n = 7), free AlPcS4 + PDT (n = 7), GNR−AlPcS4 complex + PDT (n = 7), GNR-AlPcS4 complex + PTT (n = 5), GNR-AlPcS4 complex + PTT + PDT (n = 7), n = number of tumors involved. Reproduced from [33], copyright permission by ACS Publication 2011.

