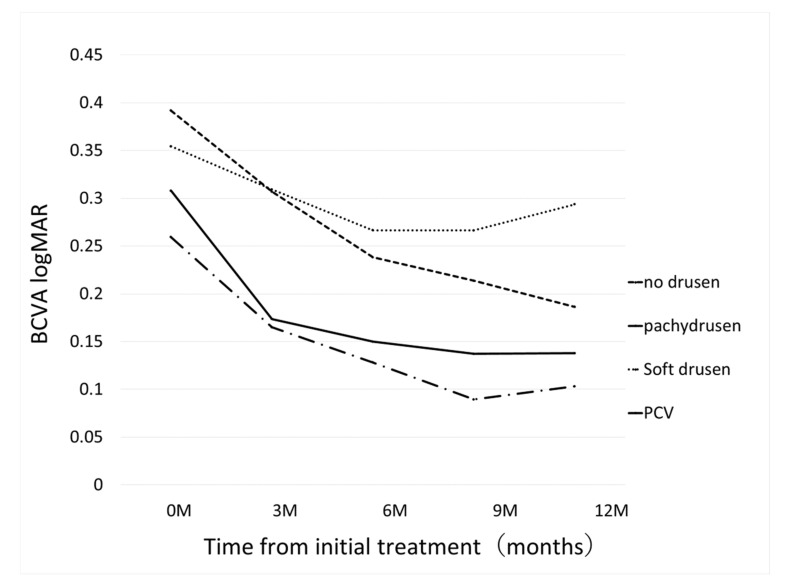
Figure 3.
Changes of best-corrected visual acuity (BCVA) from initial treatment according to the groups. In pachydrusen group, BCVA improved from 0.26 ± 0.32 (baseline) to 0.17 ± 0.19 (p = 0.276), 0.13 ± 0.20 (p = 0.11), 0.089 ± 0.16 (p = 0.054), 0.10 ± 0.20 (p = 0.081) at 3 months, 6 months, 9 months, and 12 months, respectively. In no drusen group, BCVA improved from 0.39 ± 0.38 (baseline) to 0.31 ± 0.34 (p = 0.023), 0.24 ± 0.32 (p = 3.8×10⁻⁶), 0.21 ± 0.29 (p = 8.25×10⁻⁸), 0.19 ± 0.28 (p = 4.8×10⁻⁷) at 3 months, 6 months, 9 months, and 12 months, respectively. In soft drusen group, BCVA improved from 0.35 ± 0.29 (baseline) to 0.31 ± 0.35 (p = 0.016), 0.27 ± 0.31 (p = 9.8×10⁻³), 0.27 ± 0.34 (p = 0.043), 0.29 ± 0.35 (p = 0.14) at 3 months, 6 months, 9 months, and 12 months, respectively. In PCV/Scarring group, BCVA improved from 0.31 ± 0.35 (baseline) to 0.17 ± 0.19 (p = 0.086), 0.15 ± 0.20 (p = 0.019), 0.14 ± 0.16 (p = 0.074), 0.14 ± 0.14 (p = 0.054) at 3 months, 6 months, 9 months, and 12 months, respectively.

