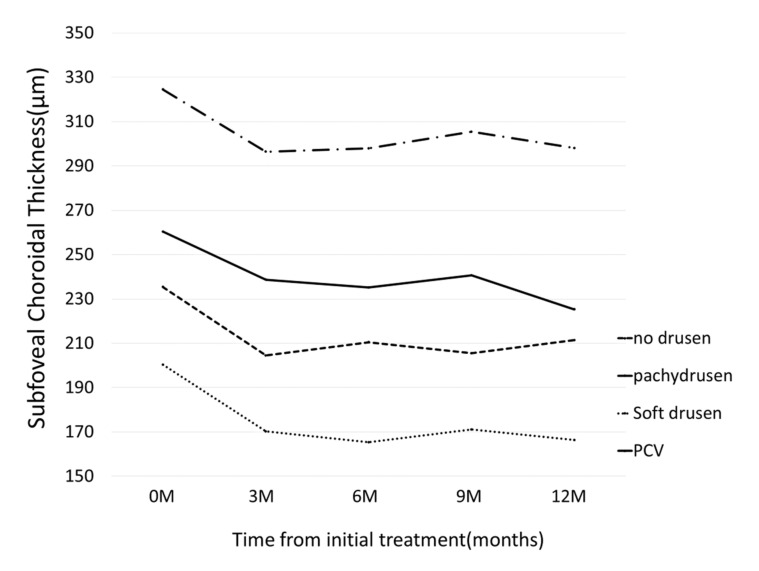
Figure 5.
Changes of subfoveal choroidal thickness (SCT) from initial treatment according to the groups. In pachydrusen group, SCT significantly decreased from 325 ± 114 (baseline) to 296 ± 108, 298 ± 120, 305 ± 119, 298 ± 118 at 3 months, 6 months, 9 months, and 12 months, respectively. (all p-value < 0.05) In no drusen group, SCT significantly decreased from 235 ± 92 (baseline) to 204 ± 82, 210 ± 89, 206 ± 83, 211 ± 88 at 3 months, 6 months, 9 months, and 12 months, respectively. (all p-value < 0.0001) In soft drusen group, SCT significantly decreased from 200 ± 76 (baseline) to 170 ± 77, 165 ± 72, 171 ± 72, 166 ± 67 at 3 months, 6 months, 9 months, and 12 months, respectively. (all p-value < 0.01) In PCV/Scarring group, SCT significantly decreased from 260 ± 114 (baseline) to 239 ± 100, 235 ± 93, 241 ± 97, 225 ± 89 at 3 months, 6 months, 9 months, and 12 months, respectively. (all p-value < 0.05).

