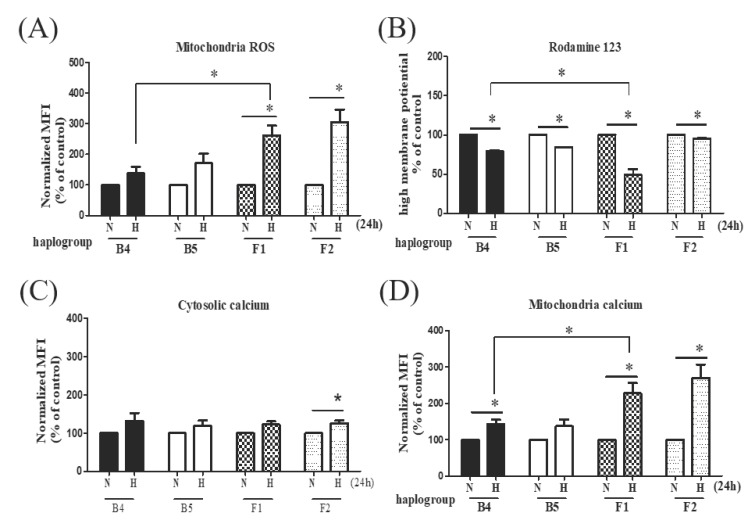
Figure 3.
Mitochondrial profile of different cybrids after hypoxia-ischemia. Comparison of mitochondrial ROS (A), mitochondrial transmembrane potential (B), cytosolic calcium levels (C), and distribution of mitochondrial calcium (D) under hypoxic-ischemic conditions in cybrid cells harboring stroke-susceptible haplogroup F and stroke-resistant haplogroup B. MitoSOX-based flow cytometry was used for detecting mitochondrial ROS. The fluorescence of mitochondrial transmembrane potential was measured by Rhodamine 123. The mobilization of distinct pools of calcium between cytosolic and mitochondria, stained with Fura2-AM and Rhod-2 AM, respectively, were measured by flow cytometry analysis. Data represent the mean ± SD of at least three independent experiments (* p < 0.05). N was used to represent normoxic and H to represent the hypoxic condition.

