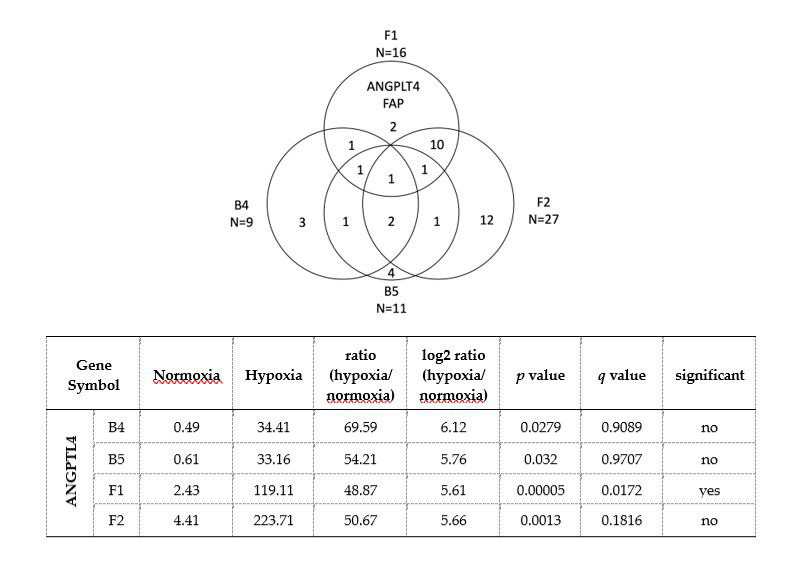
Figure 5.
Gene expression profiling of F1 and F2 cybrids compared to B4 and B5 cybrids using the RNASeq technology. The Venn diagram illustrates the number of differentially expressed genes (DEGs) between hypoxic-ischemic for 24 h and normoxic conditions in cybrids harboring haplogroups F1, F2, B4, and B5. The two genes specific to stroke-susceptible haplogroup F1 were ANGPLT4 and FAP. FAP: Fibroblast activation protein alpha; ANGPLT4: Angiopoietin like 4; FPKM: Fragments Per Kilobase of transcript per Million mapped reads; q-value, false discovery rate (FDR) adjusted p-value.

