Figure 3.
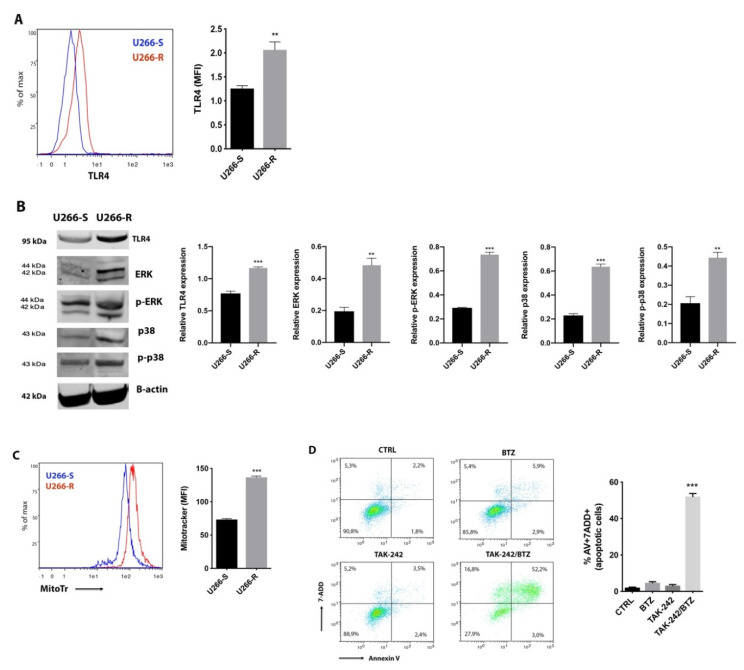
Combined treatment with TLR4 inhibitor and BTZ overcame proteasome inhibitors (PI) resistance and induced apoptosis in U266-R. (A) A representative histogram of a flow cytometric analysis showing U266-S (blue line) and U266-R (red line) stained with anti-TLR4 antibody. The TLR4-mean fluorescence intensity (MFI) was calculated and plotted. (B) Western blot analysis of TLR4, ERK, p-ERK, p38 and p-p38 in U266-S vs. U266-R. β-actin protein was used as total protein loading reference. For analysis of Western blot, the optical density of the bands was measured using Scion Image software. (C) Mitochondrial mass was analyzed using Mitotracker staining. A representative histogram for U266-S (blue line) and U266-R (red line) is shown and Mitotracker-MFI analysis is plotted. (D) Representative dot plots of the effect of TAK-242/BTZ treatment on the viability of U266-R cells is shown (left panel). The graph (right panel) shows the mean values of the percentage of apoptotic cells after annexin-V-FITC and 7-ADD staining. All results shown represent the means of four independent experiments; bars indicate the standard error means. ** p < 0.01; *** p < 0.001.

