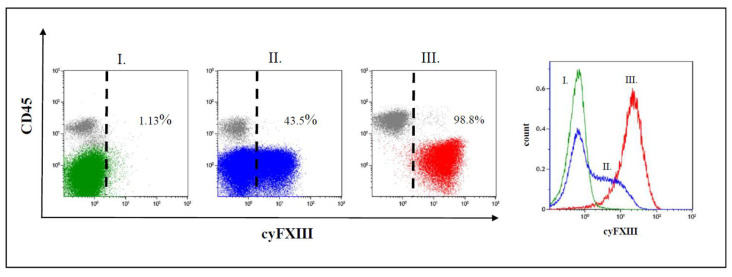
Figure 1.
Representative dot plots and histograms of leukemic lymphoblasts. There are three different patterns of cytoplasmic FXIII-A expression in terms of positivity of leukemic lymphoblasts (CD45 negative population): (I) negative expression pattern below 20%, (II) dim positive expression pattern between 20% and 79%, and (III) bright positive expression pattern ≥ 80% of leukemic lymphoblasts with an FXIII-A staining exceeding the intensity of negative controls, i.e., residual normal lymphocytes (grey). Based on FXIII-A expression intensity of normal residual lymphocytes, the threshold of positivity is marked by the dashed line on the respective dot-plots. Percentages are referring to lymphoblasts. The intensity of the FXIII-A expression increased continuously, as the histogram of lymphoblasts with dim expression pattern shows (indicated by blue colour), which excludes the existence of a distinct FXIII-A negative (green colour) and a FXIII-A bright (red colour) subpopulation.

