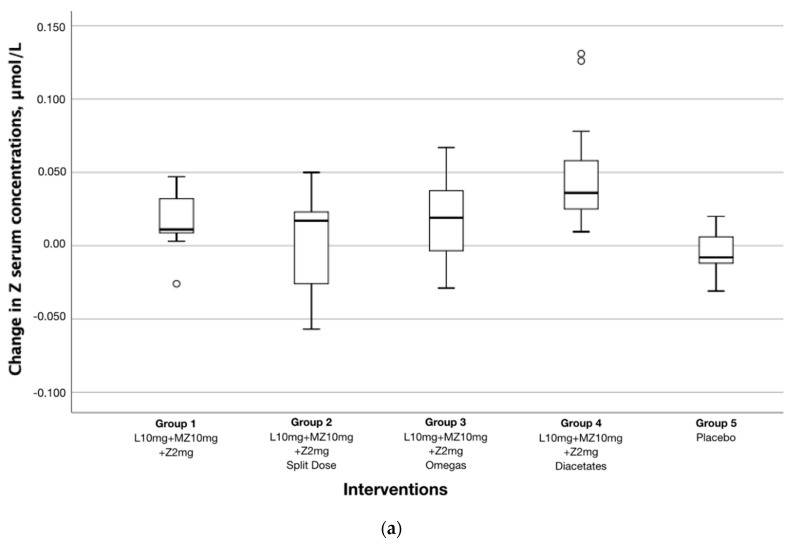
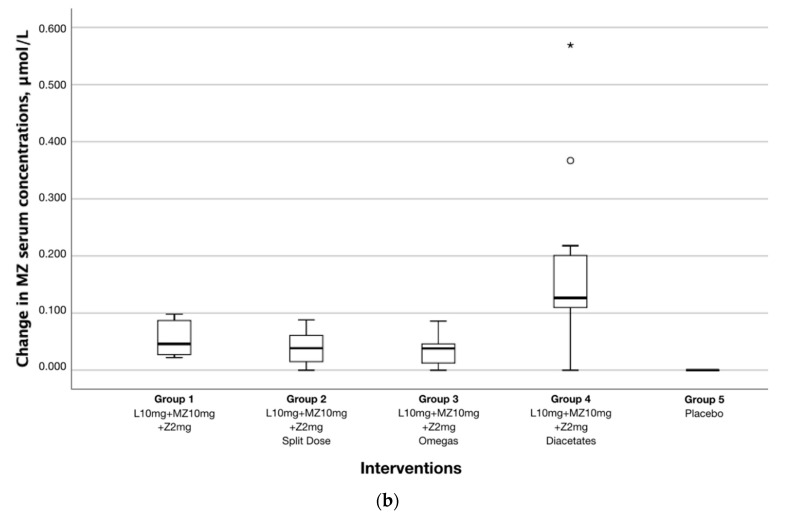
Figure 4.
Effect of different formulations in change of serum concentrations. Between-group differences in change in (a) Z and (b) MZ serum concentrations expressed as change from baseline and 6 months. Z and MZ serum response in Group 4 was significantly higher compared to the other active interventions and placebo (p < 0.000 to p = 0.019). Outliers are marked with a circle (O) and extreme outliers are marked with an asterisk (*) on the boxplot


