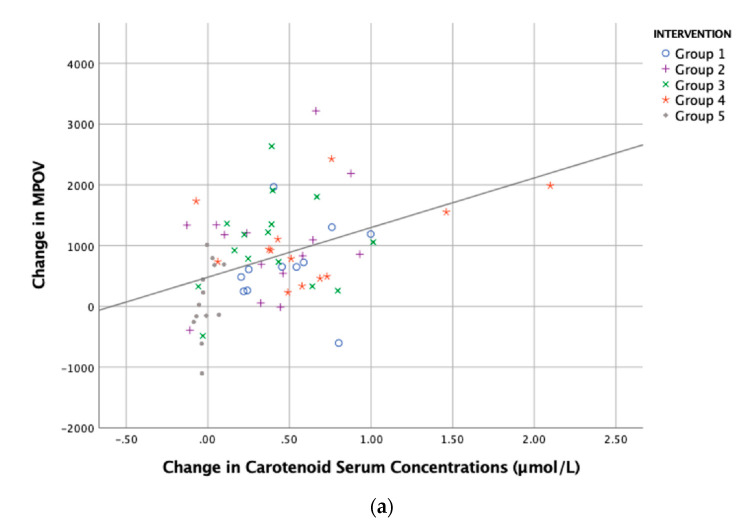
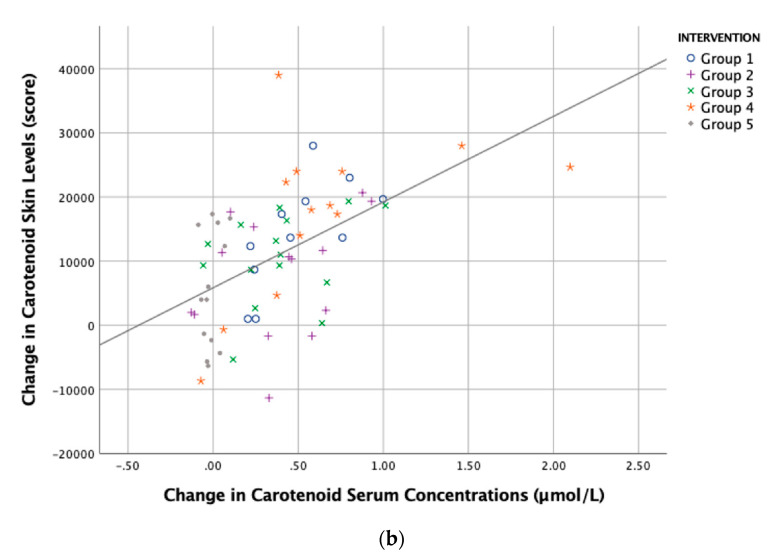
Figure 5.
The relationship between the change in carotenoid serum concentration and change in tissue (response). Linear regression analyses of total carotenoid serum concentrations (L + Z + MZ) and (a) MPOV (r = 0.408, p = 0.001), and (b) carotenoid skin score (r = 0.528, p < 0.001). Interventions are as follows: Group 1, L (10 mg) + MZ (10 mg) + Z (2 mg) provided in one capsule; Group 2, L (10 mg) + MZ (10 mg) + Z (2 mg) provided in two capsules; Group 3, L (10 mg) + MZ (10 mg) + Z (2 mg) provided in DHA (430 mg) and EPA (90 mg) in two capsules; and Group 4, Ld (10 mg) + MZd (10 mg) + Zd (2 mg) provided in one capsule; or Group 5, placebo (sunflower oil).


