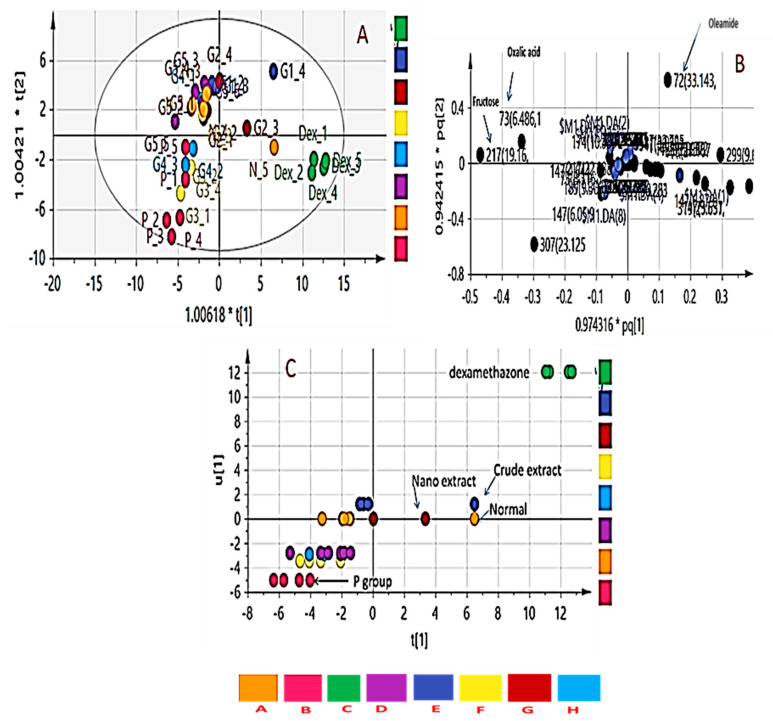
Figure 7.
Orthogonal partial least-squares-discriminant analysis (OPLS-DA) score plots obtained from modelling serum metabolites detected using GCMS in the different rat groups. (A) Score plot showing a separation of healthy control animals, treated groups and colitis rats, (B) Loading plot for PC1 and PC2 components contributing peaks. (C) Classes inner relation of the eight rat groups with colitis group showing separation from the normal control group and treatment groups. (A) negative control, (B) positive control, (C) dexamethasone standard, (D) nano-Ag, (E) ASBE, (F) ASBE plus nano-Ag, (G) ASB nano-extract, and (H) ASB nano extract plus nano-Ag.

